Overhead costs are the indirect expenses a business incurs to support its operations. Think of them as the bills you pay just to keep the doors open: office rent, insurance, administrative salaries, and accounting software. These are costs that can't be traced directly to producing a particular product or delivering a specific service.
Unlike direct costs, overhead generally supports the business as a whole. For most service businesses, it's the cost of having a business at all, not the cost of making a sale.
Understanding overhead matters because these expenses affect more than just profitability. They also create cash obligations that must be paid even when customers haven't settled their invoices.
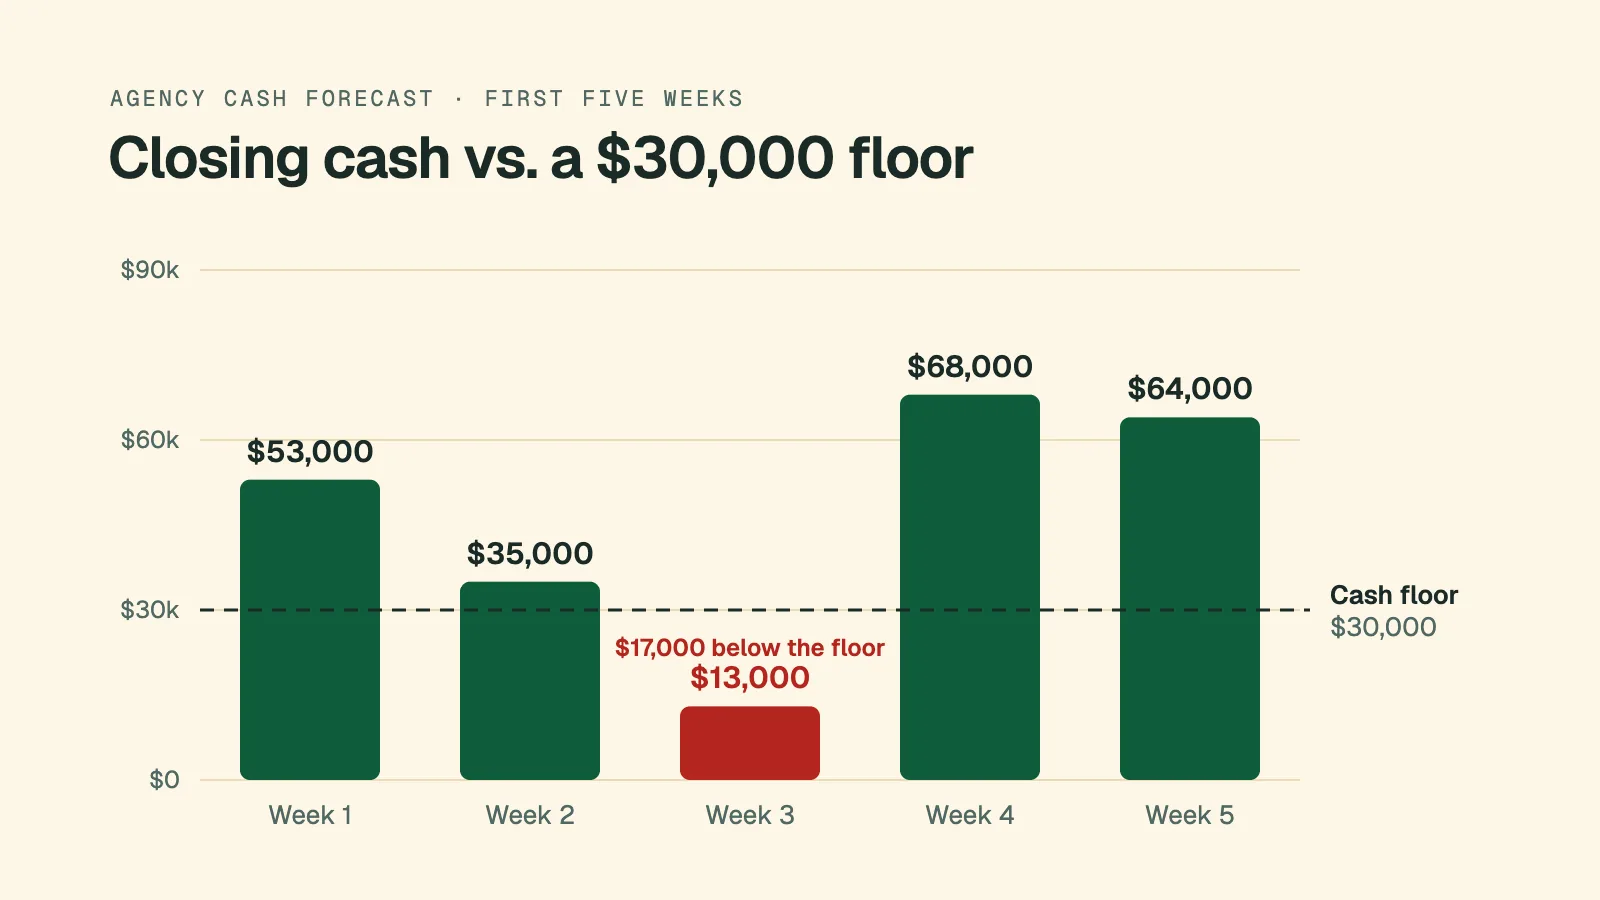
Imagine running a marketing agency with $20,000 in monthly overhead. Your business generates $80,000 in revenue, and your income statement shows a nice profit.
But what happens when your biggest client pays four weeks late?
Your rent is still due. Payroll still needs to clear. Those software subscriptions keep charging your account whether you have new work lined up or not.
That's the distinction business owners need to understand: overhead affects your profitability, but the timing of overhead payments affects your cash flow.
This guide explains what overhead costs are, how to calculate them, and how to forecast their impact on your business.
What Is Overhead in Business?
Overhead refers to the indirect costs required to operate a business. These expenses support all your day-to-day operations but can't be conveniently or economically assigned to a specific product, project, or customer.
Every business needs resources beyond those directly involved in delivering its products or services.
A consulting agency needs accounting software, insurance, and administrative support to function. A retailer needs store facilities, utilities, and management. A SaaS company incurs corporate administration, legal fees, and other shared operating costs.
These are all common examples of overhead.
Direct Costs vs. Overhead Costs
The distinction comes down to how an expense relates to the product or service being delivered.
| Direct costs | Overhead costs |
|---|---|
| Materials used for a specific product | General office rent |
| Labor directly attributable to a project | Administrative employee salaries |
| Customer-specific subcontractor expenses | General business insurance |
| Product-specific production costs | Corporate accounting software |
| Hosting attributable to delivering a SaaS service | General corporate administration |
Consider a marketing agency producing a website for a client.
The developer working directly on the project may represent a direct labor cost.
The accountant preparing the agency's financial statements represents an indirect administrative cost.
Both are absolutely necessary. However, they serve different accounting and management purposes.
An important distinction: Not every direct cost changes immediately with sales, and not every overhead expense is fixed. Direct versus indirect describes cost attribution, while fixed versus variable describes cost behavior.
What Are Examples of Overhead Costs?
Overhead expenses vary depending on the business model, operating structure, and accounting practices.
Here are common examples of overhead costs for a small business.
| Expense category | Examples | Typical cost behavior |
|---|---|---|
| Office rent | Headquarters, administrative offices | Fixed |
| Utilities | Electricity, water, shared office internet | Fixed or mixed |
| Insurance | General liability, business insurance | Usually fixed over the policy period |
| Administrative payroll | Bookkeepers, HR, office managers | Usually fixed within a staffing range |
| Professional services | Legal, accounting, compliance support | Fixed or variable |
| Software subscriptions | Accounting, communication, internal administration | Fixed or mixed |
| Office supplies | Paper, stationery, printing materials | Variable |
| Equipment maintenance | Office equipment servicing | Fixed or variable |
| General marketing | Brand campaigns, corporate website | Discretionary or variable |
| Administrative travel | Internal meetings, management travel | Variable |
These are typical classifications, not universal rules.
For example, a software subscription used exclusively to deliver a customer's service may be treated as a direct service cost rather than administrative overhead.
Similarly, factory rent is manufacturing overhead, which is generally included in inventory costs instead of immediately expensed as administrative overhead.
Overhead Examples by Business Type
SaaS companies
Common administrative overhead includes corporate software subscriptions, legal fees, finance personnel, and general management expenses.
Cloud computing costs directly attributable to delivering a subscription service may instead be classified as cost of revenue.
Marketing agencies
Typical overhead includes office rent, administrative staff, insurance, and shared management systems.
Freelancers hired specifically for a client engagement generally represent direct project costs.
Retail businesses
Store management, corporate administration, and certain occupancy expenses may be overhead.
Merchandise purchased for resale is inventory and normally enters cost of goods sold when sold, rather than being treated as ordinary administrative overhead.
Manufacturing companies
Factory supervision, production-facility depreciation, and indirect production supplies are examples of manufacturing overhead.
These costs may be allocated to inventory and ultimately recognized in cost of goods sold.
The classification matters because it affects gross margin, operating profitability, and pricing decisions.
The Three Types of Overhead Costs
Overhead can be categorized based on how expenses respond to changes in business activity.
1. Fixed Overhead Costs
Fixed overhead expenses remain relatively constant within a relevant range of activity.
Examples include:
- Monthly office rent
- Salaried administrative personnel
- Fixed software subscriptions
- Business insurance premiums
- Office equipment leases
Imagine an agency paying $5,000 in monthly rent.
Whether it serves five clients or fifteen, the rent generally remains $5,000 until the lease changes or the company requires additional space.
Fixed overhead creates predictable financial commitments.
However, predictable doesn't mean harmless. These obligations can become difficult to meet when revenue collections slow down.
2. Variable Overhead Costs
Variable overhead expenses change with an underlying activity driver.
Examples might include:
- Usage-based administrative software charges
- Transaction-based administrative fees
- Certain indirect supplies
- Usage-sensitive facility expenses
Suppose a company pays $100 monthly for an internal software platform plus $5 for every active employee.
The $5 per-employee portion is the variable overhead: as headcount increases, it rises.
Variable overhead becomes particularly important when a business scales because additional activity can generate additional indirect costs.
However, the relevant driver may be employees, transactions, equipment hours, or another activity measure, not necessarily revenue.
3. Semi-Variable Overhead Costs
Semi-variable, or mixed, overhead contains both fixed and variable components.
Consider a telecommunications contract:
- Fixed monthly charge: $100
- Usage charge: $0.50 per billable unit
- Monthly usage: 400 billable units
The expense would be:
Total cost = $100 + (400 × $0.50) = $300
The company owes $100 regardless of usage, but the remaining cost changes with activity.
Understanding this distinction helps business owners forecast expenses more accurately.
| Type | Behavior | Example |
|---|---|---|
| Fixed overhead | Stable within a relevant activity range | Office rent |
| Variable overhead | Changes with an activity driver | Usage-based fees |
| Semi-variable overhead | Fixed base plus variable component | Base subscription plus per-user charges |
How to Calculate Overhead Costs
Calculating overhead starts with identifying indirect expenses over a consistent accounting period.
Step 1: Identify Your Indirect Expenses
Review your general ledger, income statement, and supporting transactions.
Separate expenses attributable to specific products or services from those supporting the business as a whole.
For accurate financial reporting, use the appropriate accounting classifications rather than relying exclusively on bank statement descriptions.
A cash payment and an accounting expense are not always recognized in the same period.
Step 2: Calculate Total Overhead
Use the following formula:
Total overhead = Sum of all relevant indirect costs for the period
Consider a consulting agency with these monthly expenses:
| Overhead expense | Monthly amount |
|---|---|
| Office rent | $5,000 |
| Administrative salary | $4,000 |
| Business insurance | $800 |
| Accounting software | $150 |
| Communication software | $300 |
| Design administration software | $600 |
| Bank service fees | $200 |
| Office supplies | $400 |
| Other shared software | $2,000 |
| Total monthly overhead | $13,450 |
The business incurs $13,450 in monthly overhead under these assumptions.
Step 3: Calculate Your Overhead Ratio
An overhead-to-revenue ratio measures indirect expenses relative to revenue.
Overhead ratio = (Total overhead ÷ Total revenue) × 100
Suppose the consulting agency earns $80,000 in revenue during the same month.
Overhead ratio = ($13,450 ÷ $80,000) × 100
Overhead ratio = 16.81%
This means overhead represents approximately 16.8% of the agency's monthly revenue.
The ratio can help track changes in cost structure over time.
However, it does not tell you whether the business is profitable on its own. You also need to account for direct expenses, other operating expenses, financing costs, and taxes.
Step 4: Calculate an Overhead Allocation Rate
An overhead allocation rate assigns indirect costs to a product, service, or project using an appropriate allocation base.
Overhead allocation rate = Total overhead to allocate ÷ Total allocation-base units
Common allocation bases include:
- Direct labor hours
- Direct labor costs
- Machine hours
- Square footage
- Relevant transaction or activity volumes
For example, suppose a different consulting firm has:
- Budgeted monthly overhead: $12,000
- Budgeted monthly direct labor hours: 600
The overhead allocation rate is:
$12,000 ÷ 600 hours = $20 per direct labor hour
A project requiring 40 direct labor hours receives:
40 × $20 = $800 in allocated overhead
This allows management to estimate a more complete project cost.
Overhead Ratio vs. Overhead Allocation Rate
These metrics answer different questions.
| Metric | Formula | Purpose |
|---|---|---|
| Overhead-to-revenue ratio | Overhead ÷ Revenue × 100 | Evaluate overall cost structure |
| Overhead allocation rate | Overhead ÷ Allocation base | Assign indirect costs to products or projects |
The distinction is especially important when estimating profitability or setting customer prices.
What Is a Good Overhead Percentage for a Small Business?
There is no universal healthy overhead percentage.
Commonly cited rules of thumb, such as keeping overhead under about 35% of revenue, vary widely by industry and by how overhead is defined.
An appropriate overhead ratio depends on the industry, business model, growth stage, cost classifications, and operational strategy.
A consulting firm may have relatively high administrative and support costs.
A SaaS company may incur substantial sales, engineering, and administrative spending while scaling.
A manufacturer may allocate significant factory overhead to inventory and cost of goods sold.
Comparing these businesses using a single percentage can be misleading.
How Revenue Changes the Overhead Ratio
Consider a business with $12,000 in fixed monthly overhead.
| Monthly revenue | Fixed overhead | Overhead ratio |
|---|---|---|
| $50,000 | $12,000 | 24% |
| $70,000 | $12,000 | 17.14% |
| $90,000 | $12,000 | 13.33% |
| $120,000 | $12,000 | 10% |
As revenue increases, the same fixed overhead becomes a smaller percentage of revenue.
This illustrates operating leverage.
However, rising revenue may also require new employees, larger facilities, more software, or other investments.
The objective isn't necessarily to minimize overhead. It's to understand whether the spending contributes sufficient operational capacity and financial value.
Questions to Ask When Evaluating Overhead
Rather than targeting an arbitrary percentage, ask:
- Is overhead growing faster than revenue?
- Which expenses are necessary to support operations?
- Are recurring costs justified by their value?
- How much overhead is committed versus discretionary?
- Can the business cover upcoming payments if collections are delayed?
- How would a new hiring decision change future cash requirements?
The final two questions are particularly important because a sustainable expense structure must work in both the income statement and the cash forecast.
Overhead vs. Operating Expenses vs. COGS
Overhead, operating expenses, and cost of goods sold are related concepts, but they are not interchangeable.
| Term | Meaning | Example |
|---|---|---|
| Overhead | Indirect costs supporting business activities or production | Administrative salaries or factory supervision |
| Operating expenses (OpEx) | Expenses incurred in operating the business, commonly including selling, general, and administrative expenses | Marketing, administration, corporate rent |
| Cost of goods sold (COGS) | Costs associated with goods sold, including allocated manufacturing overhead where applicable | Materials, production labor, allocated factory costs |
Administrative overhead is commonly included in operating expenses.
Manufacturing overhead, however, may be allocated to inventory and recognized in COGS as the goods are sold.
That distinction is important because not all overhead appears in the same section of an income statement.
Example: A Small Bakery
A bakery incurs:
- Flour and sugar for bread production
- Baker wages directly involved in production
- Factory electricity
- Production supervisor salary
- Accounting software
- Office administrator salary
The ingredients and direct production labor are production costs.
Factory electricity and production supervision may be manufacturing overhead allocated to inventory.
Accounting software and general administrative salaries are ordinarily period operating expenses.
The accounting treatment affects when those costs appear in reported profit.
For more information about inventory and production cost treatment, see the IRS Tax Guide for Small Business (written for sole proprietors who file Schedule C).
How to Allocate Overhead to Products or Projects
Overhead allocation is useful when a company wants to determine the full cost of delivering a product or completing a client engagement.
Consider a consulting business estimating a new project.
Assume:
- Fully loaded direct labor cost: $50 per hour
- Overhead allocation rate: $20 per hour
- Required project hours: 40
The calculation is:
- Direct labor cost: 40 × $50 = $2,000
- Allocated overhead: 40 × $20 = $800
- Total allocated project cost: $2,800
If the company wants a 20% profit margin on this simplified cost base:
Required selling price = Total cost ÷ (1 − Target margin)
$2,800 ÷ 0.80 = $3,500
The corresponding selling price is:
$3,500 ÷ 40 hours = $87.50 per hour
At that price:
- Project revenue: $3,500
- Allocated cost: $2,800
- Project profit before other unallocated items: $700
- Profit margin on price: 20%
The allocation rate helps reveal expenses that might otherwise be overlooked when pricing projects.
An important caveat: internal project profitability depends on the chosen allocation method. An allocated cost is not necessarily an incremental cash cost, and a different allocation basis may change the apparent profitability of a project.
How Overhead Affects Profitability, Cash Flow, and Runway
Overhead affects profitability through expense recognition, but it affects cash flow when payments actually leave the business.
Those events don't always happen at the same time.
A business can recognize revenue today and collect the corresponding cash weeks later.
Likewise, it may recognize an insurance expense over the policy period while paying the premium in a single annual installment.
This creates a timing difference between accounting performance and cash availability.
Why a Profitable Business Can Experience a Cash Shortfall
Imagine an agency completes $80,000 of client work during December.
Its simplified accrual-basis income statement shows:
| Item | Amount |
|---|---|
| Revenue earned | $80,000 |
| Direct service costs | ($40,000) |
| Operating overhead | ($20,000) |
| Operating profit | $20,000 |
The company generated $20,000 in operating profit.
But suppose the $80,000 customer invoice won't be paid until January.
Meanwhile, the business must pay its employees, rent, and other expenses in December.
Its bank balance can decline even while its income statement reports a profit.
Profit answers whether the business earned more than it expensed. Cash flow answers whether it has the money available when payments are due.
Why Overhead Creates Cash Flow Risk
Some overhead expenses are difficult to reduce quickly.
A company may be contractually committed to:
- Office rent
- Software subscriptions
- Administrative payroll
- Equipment leases
- Insurance payments
If customer collections slow down, those commitments remain.
The JPMorgan Chase Institute found that half of small businesses hold a cash buffer large enough to cover only about 27 days of typical outflows.
This is why fixed overhead deserves particular attention in cash flow planning.
What Does Overhead Mean for Cash Runway?
Cash runway measures how long a company can continue operating before its available cash is exhausted under specified cash flow assumptions.
A simplified runway formula for a business experiencing consistent positive monthly net cash burn is:
Cash runway = Available cash ÷ Monthly net cash burn
Suppose:
- Available cash: $120,000
- Monthly cash outflows: $45,000
- Monthly cash inflows: $25,000
Monthly net cash burn = $45,000 − $25,000 = $20,000
Estimated runway = $120,000 ÷ $20,000 = 6 months
This is a simplified estimate. It assumes the net burn rate remains constant and excludes additional timing complications.
If inflows consistently exceed outflows, there is no finite cash exhaustion date under those unchanged assumptions.
Even with a healthy monthly average, however, a business may experience a temporary cash shortage before customer payments arrive.
That is why weekly forecasting matters.
For a deeper explanation, see Runway vs. Burn Rate: Differences, Formulas, and Founder Decisions.
How to Forecast Overhead Using a 13-Week Cash Flow Forecast
A 13-week cash flow forecast projects expected cash receipts and payments across the next thirteen weeks.
Instead of simply estimating monthly expenses, it places payments in the weeks when they are expected to occur.
This makes it easier to identify periods when overhead payments and customer collections create temporary cash pressure.
Step 1: Identify Recurring Payments
Start with obligations such as:
- Administrative payroll
- Rent
- Software subscriptions
- Insurance
- Utilities
- General office expenses
Include direct operating payments separately so the forecast captures the business's full anticipated cash requirements.
Step 2: Assign Payment Dates
A business may have $20,000 in monthly overhead, but that doesn't mean it pays $5,000 every week.
Rent may be due on the first day of the month.
Payroll may clear on the fifteenth.
Software subscriptions may charge on different dates.
The dates matter because cash must be available when each payment settles.
Step 3: Estimate Customer Collections
Forecast when customers are likely to pay, rather than assuming every invoice is collected on its contractual due date.
Use actual payment history, invoice status, contractual terms, and known customer behavior where available.
Step 4: Calculate Weekly Closing Cash
The basic formula is:
Closing cash = Opening cash + Cash inflows − Cash outflows
The closing balance for one week becomes the opening balance for the next.
Step 5: Compare Expected and Delayed-Payment Scenarios
Consider the following illustrative 13-week forecast for a service agency.
Starting assumptions
- Opening cash: $45,000
- Weekly direct service cash costs: $4,500
- Weekly office supplies: $250
- Rent and general marketing: $7,000 combined in Weeks 1, 5, 9, and 13
- Administrative payroll and software: $4,500 combined in Weeks 2, 6, and 10
- Utilities: $500 in Weeks 4, 8, and 12
- Customer collections: $18,000 in Weeks 2, 6, and 10, plus $12,000 in Weeks 4, 8, and 12
For this example, each cost is assumed to settle in the specified week. The weekly total outflows include both direct costs and overhead.
Scenario A: All collections arrive as expected.
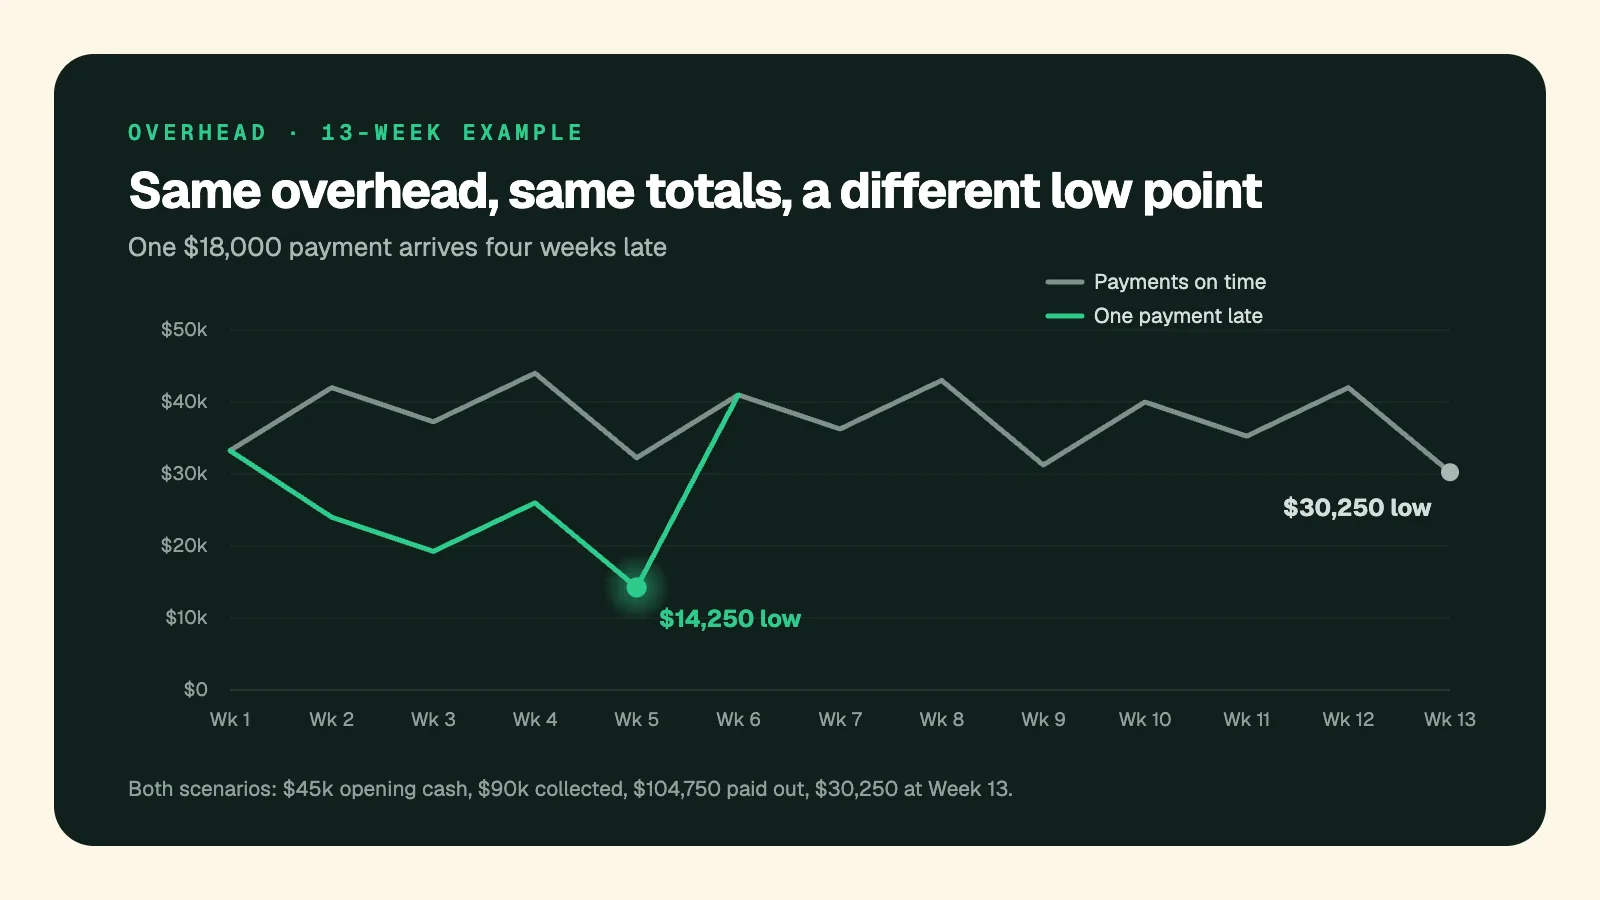
Scenario B: The $18,000 payment expected in Week 2 arrives in Week 6 instead. All other assumptions remain unchanged.
13-Week Cash Flow Comparison
| Week | Expected collections | Delayed collections | Cash outflows | Baseline closing cash | Delayed closing cash |
|---|---|---|---|---|---|
| 1 | $0 | $0 | $11,750 | $33,250 | $33,250 |
| 2 | $18,000 | $0 | $9,250 | $42,000 | $24,000 |
| 3 | $0 | $0 | $4,750 | $37,250 | $19,250 |
| 4 | $12,000 | $12,000 | $5,250 | $44,000 | $26,000 |
| 5 | $0 | $0 | $11,750 | $32,250 | $14,250 |
| 6 | $18,000 | $36,000 | $9,250 | $41,000 | $41,000 |
| 7 | $0 | $0 | $4,750 | $36,250 | $36,250 |
| 8 | $12,000 | $12,000 | $5,250 | $43,000 | $43,000 |
| 9 | $0 | $0 | $11,750 | $31,250 | $31,250 |
| 10 | $18,000 | $18,000 | $9,250 | $40,000 | $40,000 |
| 11 | $0 | $0 | $4,750 | $35,250 | $35,250 |
| 12 | $12,000 | $12,000 | $5,250 | $42,000 | $42,000 |
| 13 | $0 | $0 | $11,750 | $30,250 | $30,250 |
All amounts are illustrative. Weekly closing balances do not capture possible intraweek cash lows.
What the Forecast Reveals
Both scenarios begin with the same $45,000.
Both eventually collect the same $90,000 over thirteen weeks.
Both incur $104,750 in total cash outflows.
And both finish Week 13 with $30,250.
But their lowest projected weekly closing cash balances are very different.
| Metric | Expected collections | Delayed collections |
|---|---|---|
| Opening cash | $45,000 | $45,000 |
| Total collections | $90,000 | $90,000 |
| Total outflows | $104,750 | $104,750 |
| Lowest weekly closing cash | $30,250 | $14,250 |
| Week of lowest balance | Week 13 | Week 5 |
| Week 13 closing cash | $30,250 | $30,250 |
The payment delay causes the minimum weekly closing cash balance to fall by $16,000, even though total collections and ending cash are unchanged.
By Week 5, the delayed-payment scenario has just $14,250 remaining.
The business hasn't necessarily become less profitable. The cash arrived later than expected.
This is the kind of risk that a monthly income statement or a simple overhead ratio can miss.
Why the Lowest Cash Balance Matters
An ending balance tells you where cash is expected to finish.
The lowest projected balance tells you how much liquidity the business may need before that point.
A business might finish a quarter with adequate cash but struggle to meet an important payment several weeks earlier.
For more accurate planning, use a rolling forecast that incorporates both overhead and direct operating expenses.
You can explore the 13-week cash flow forecast template or follow the step-by-step Excel forecasting guide.
How to Reduce Overhead Costs Without Hurting Growth
Reducing overhead can improve profitability and cash flow, but cutting every indirect expense is rarely a sustainable strategy.
Some overhead supports productivity, compliance, customer experience, and growth.
The goal should be to eliminate unnecessary spending while preserving the resources that make the business effective.
1. Audit Recurring Software Subscriptions
Review recurring software charges and identify:
- Unused subscriptions
- Duplicate tools
- Unnecessary premium plans
- Licenses assigned to inactive users
- Contracts renewing before they are needed
For example, canceling two unused subscriptions costing $150 a month each reduces annual cash spending by $3,600, assuming there are no cancellation fees or replacement costs.
2. Review Vendor and Facility Contracts
Examine significant recurring commitments such as office leases, insurance, professional services, and equipment rentals.
Consider whether contract terms still reflect the company's needs.
A lower price is useful, but payment frequency can matter just as much.
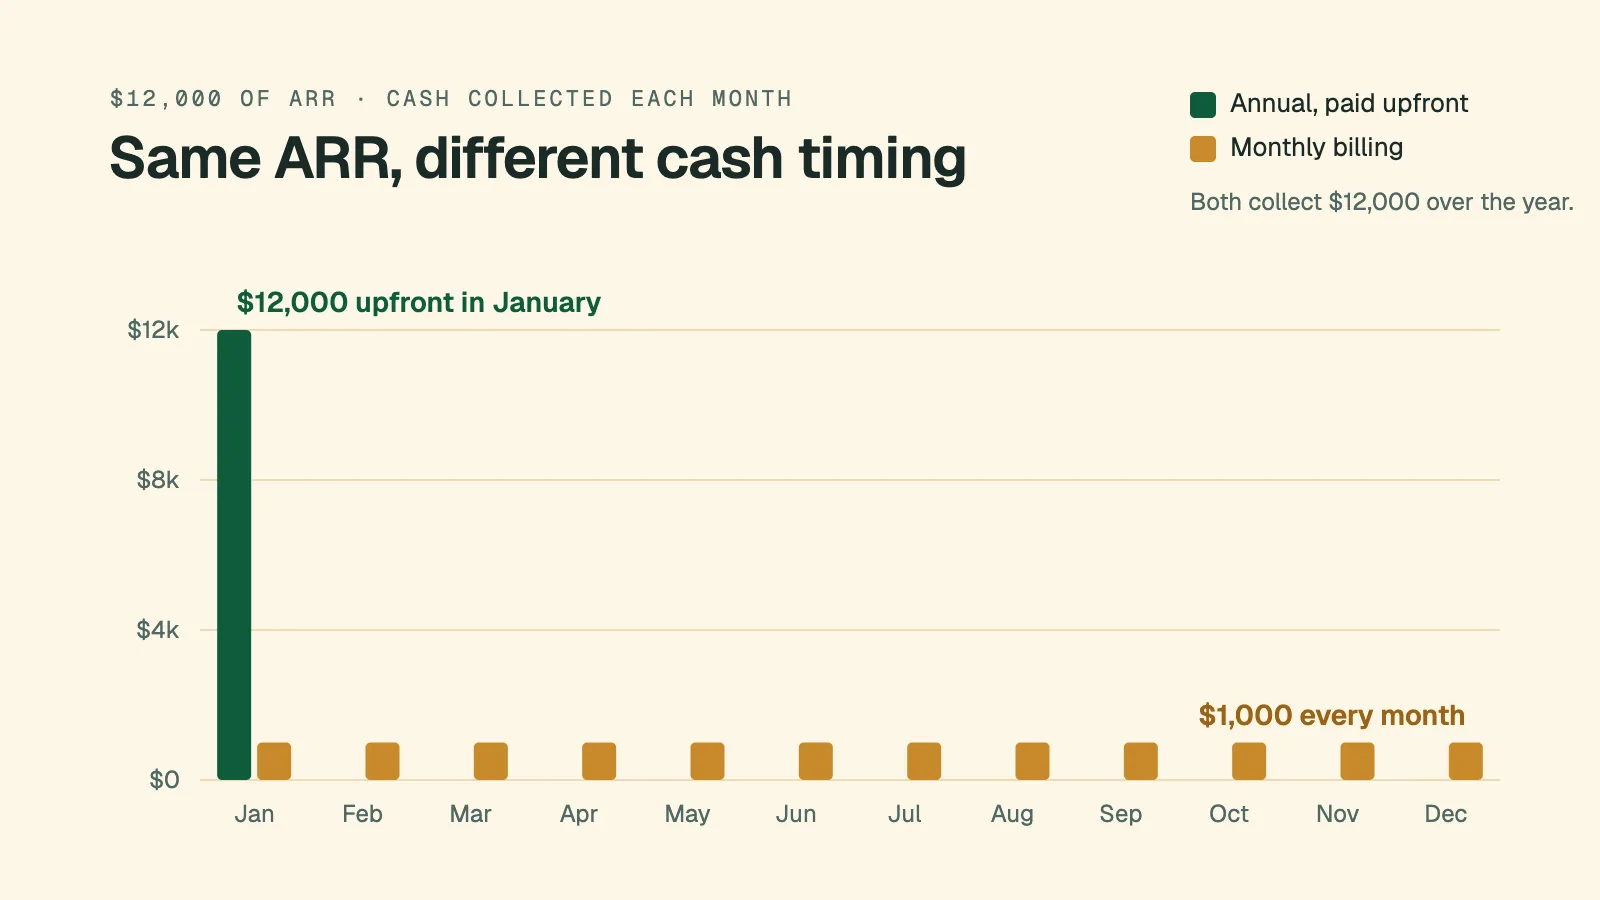
For example, an annual software contract may cost less overall but require a large upfront payment. That payment could create short-term liquidity pressure.
3. Evaluate Administrative Processes
Repetitive administrative work may be improved through better processes or automation.
Examples include:
- Invoice reconciliation
- Expense categorization
- Internal reporting
- Approval workflows
- Financial data consolidation
Evaluate the full cost of any proposed automation, including implementation, maintenance, training, and integration requirements.
4. Forecast Hiring Decisions
Before hiring an administrative employee, estimate the complete financial commitment.
Include salary, payroll taxes, benefits, equipment, software, and onboarding costs.
Then model the new expenses against expected customer collections.
A hire may be economically justified over the next year but still create a cash shortage during the first several months.
5. Review Overhead Alongside Cash Flow
An expense can be affordable on an annual budget yet difficult to pay on its due date.
For every meaningful new commitment, ask:
What will this expense do to our lowest projected cash balance over the next thirteen weeks?
That question connects cost management to actual liquidity.
The Bottom Line
Overhead is more than a collection of rent payments, salaries, and software subscriptions.
It's part of the financial structure that determines how much a business must spend to operate.
Understanding overhead helps owners calculate costs, assess profitability, price projects, and evaluate operating efficiency.
But calculating overhead is only the beginning.
A company can understand its costs perfectly and still experience a cash shortage when customer payments arrive later than expected.
That's why forward-looking cash flow planning matters.
Know what your overhead costs. Then know when it will affect your cash balance.
For a practical next step, learn what cash flow forecasting is and how to use a rolling forecast to anticipate the financial commitments ahead.
References
- Internal Revenue Service: Publication 334 (2025), Tax Guide for Small Business (For Individuals Who Use Schedule C). Guidance on inventory, cost of goods sold, and production-related costs.
- QuickBooks: How to Calculate Overhead Costs: Essential Formulas for 2026. Overview of overhead definitions and calculation methods.
- JPMorgan Chase Institute: Cash Is King: Flows, Balances, and Buffer Days (2016). Research on the liquidity and cash buffers of U.S. small businesses.
- Investopedia: Overhead Rate: Meaning, Formula, and Examples. Explanation of overhead allocation rates and allocation bases.