A 13-week cash flow forecast in Excel is one sheet with 13 weekly columns, a block of cash in, a block of cash out, and a closing balance that carries from each week into the next.
This guide builds that sheet from an empty workbook in eight steps. Six formulas do the calculating, and a seventh fills in the dates. If you would rather start from the finished file, the free template below has the same layout, cell for cell.
Download the free 13-week template
The sheet this guide builds, with the formulas already in place. Works in Excel, Google Sheets, and Numbers. No email required.
Download the XLSX templateNew to the model itself? Start with what a 13-week cash flow forecast is and why 13 weeks is the standard horizon, then come back here to build one.
What Does the Finished Sheet Look Like?
The finished sheet has one column of labels, 13 columns of weeks, and 24 rows.
The rows, in order:
- row 4: the headers, Week 1 to Week 13
- row 5: the date each week begins
- row 6: opening balance
- rows 8 to 10: cash in (customer collections, annual and quarterly contract payments, other inflows)
- row 11: total cash in
- rows 13 to 18: cash out (payroll and contractors, payroll taxes and benefits, rent and utilities, software and subscriptions, marketing, other outflows)
- row 19: total cash out
- row 20: net cash flow
- row 21: closing balance
- row 23: your cash floor
- row 24: a check that flags any week below the floor
Column A holds the labels. Columns B to N hold weeks 1 to 13. Every cell reference in this guide uses that layout, and so does the template.
Step 1: Lay Out 13 Weekly Columns
Type Line item in A4, then Week 1 to Week 13 across B4 to N4.
In B5, enter the Monday your forecast starts. In C5, enter this formula and copy it across to N5:
=B5+7
Excel stores dates as numbers, so adding 7 gives the same weekday one week later. Every column now has a real date, which matters in step 8.
Step 2: Enter the Opening Balance
In B6, type the cash in your bank accounts today. Use the real balance, not the balance in your accounting system.
This is the only opening balance you type. Weeks 2 to 13 will be formulas.
Step 3: Add the Cash-In Rows
Label rows 8 to 10 in column A:
- A8: Customer collections
- A9: Annual and quarterly contract payments
- A10: Other inflows
Keep large contract payments on their own row. A $48,000 annual renewal that lands in one week should be easy to see, not buried in a weekly average.
In B11, total the three rows:
=SUM(B8:B10)
Microsoft's documentation describes the function simply: "The SUM function adds values." Using a range (B8:B10) instead of adding three cells means a row inserted inside the block is picked up without editing the formula.
Step 4: Add the Cash-Out Rows
Label rows 13 to 18 in column A:
- A13: Payroll and contractors
- A14: Payroll taxes and benefits
- A15: Rent and utilities
- A16: Software and subscriptions
- A17: Marketing
- A18: Other outflows
In B19, total them:
=SUM(B13:B18)
Change the labels to match your business. The structure matters more than the names: every dollar that leaves the bank belongs in exactly one row.
Step 5: Calculate Net Cash Flow and the Closing Balance
In B20, subtract cash out from cash in:
=B11-B19
In B21, add the result to the opening balance:
=B6+B20
B21 is the number the whole sheet exists to produce: the cash you expect to have at the end of week 1.
Step 6: Chain Each Week to the One Before It
In C6, set week 2's opening balance to week 1's closing balance:
=B21
Copy C6 across to N6. Then copy the formulas in B11, B19, B20, and B21 across to column N.
This chain is what makes the sheet a forecast and not a list. Move one payment from week 4 to week 6 and every closing balance from week 4 onward changes with it.
Step 7: Add a Cash Floor and a Check
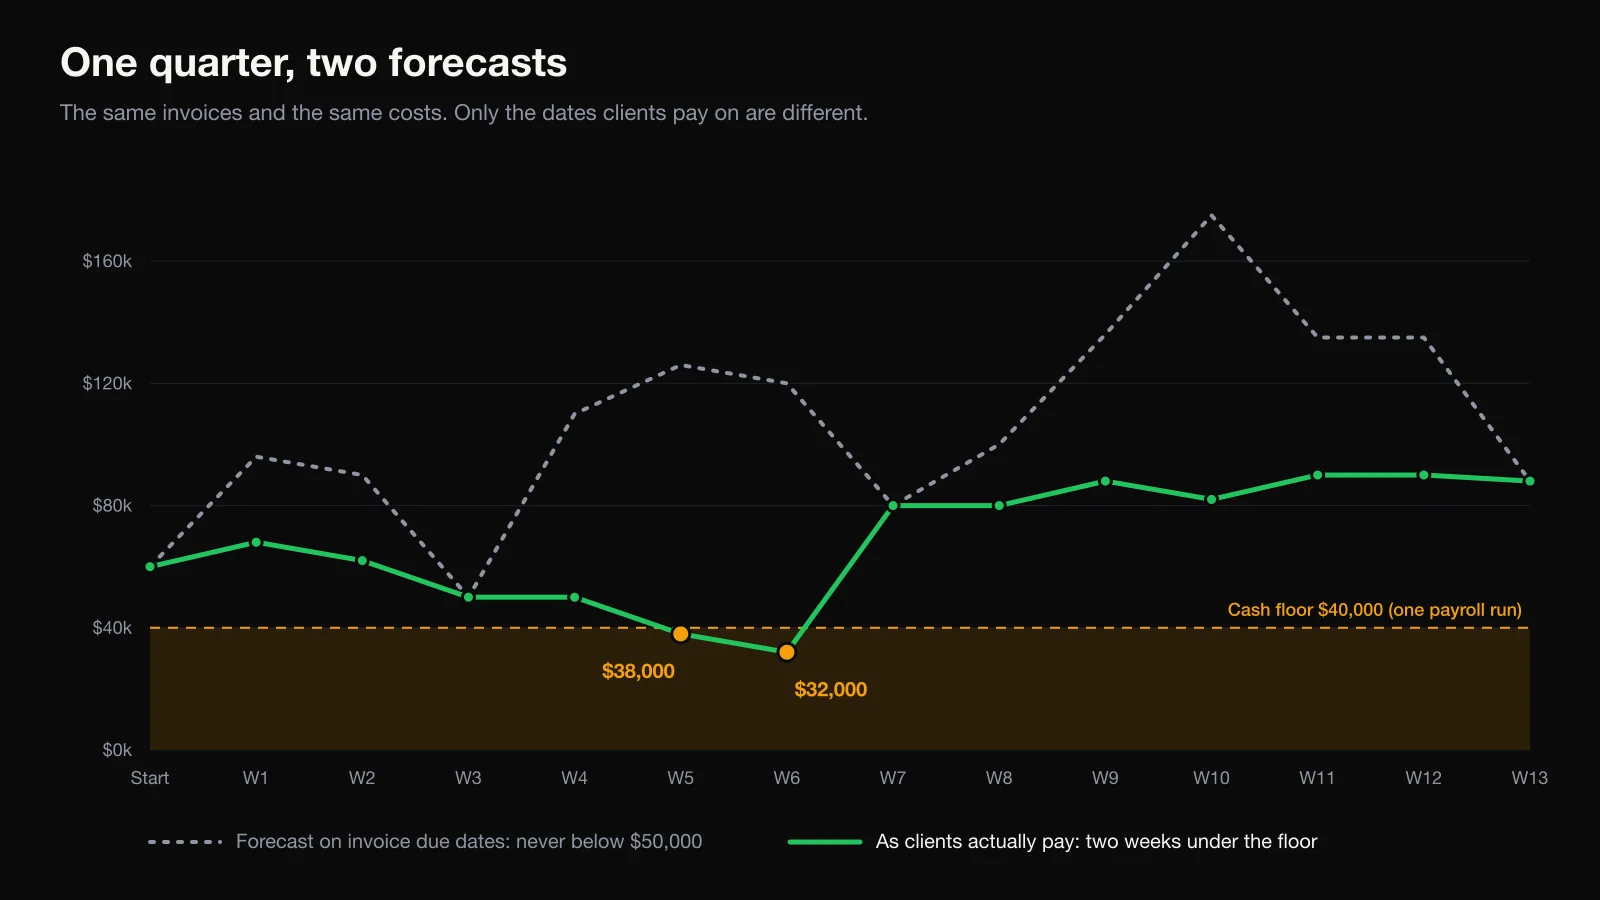
A closing balance above zero is not the same as a safe one. Pick a floor: the lowest balance you are willing to hold. Type it in B23.
In B24, enter:
=IF(B21<$B$23,"BELOW FLOOR","OK")
Copy B24 across to N24. Each week now reads OK or BELOW FLOOR.
Two details make this work. Microsoft describes IF as a function that "allows you to make logical comparisons between a value and what you expect", which is exactly the test here. And the dollar signs in $B$23 make the reference absolute. Without them, copying the formula to column C would compare week 2 against C23, which is empty. Microsoft's guide to cell references explains the difference.
Step 8: Enter Amounts in the Week the Cash Moves
The formulas are the easy part. The forecast is only as good as the weeks you put the numbers in.
Four rules cover most of it:
- Enter a receipt in the week the customer will pay, not the week you send the invoice.
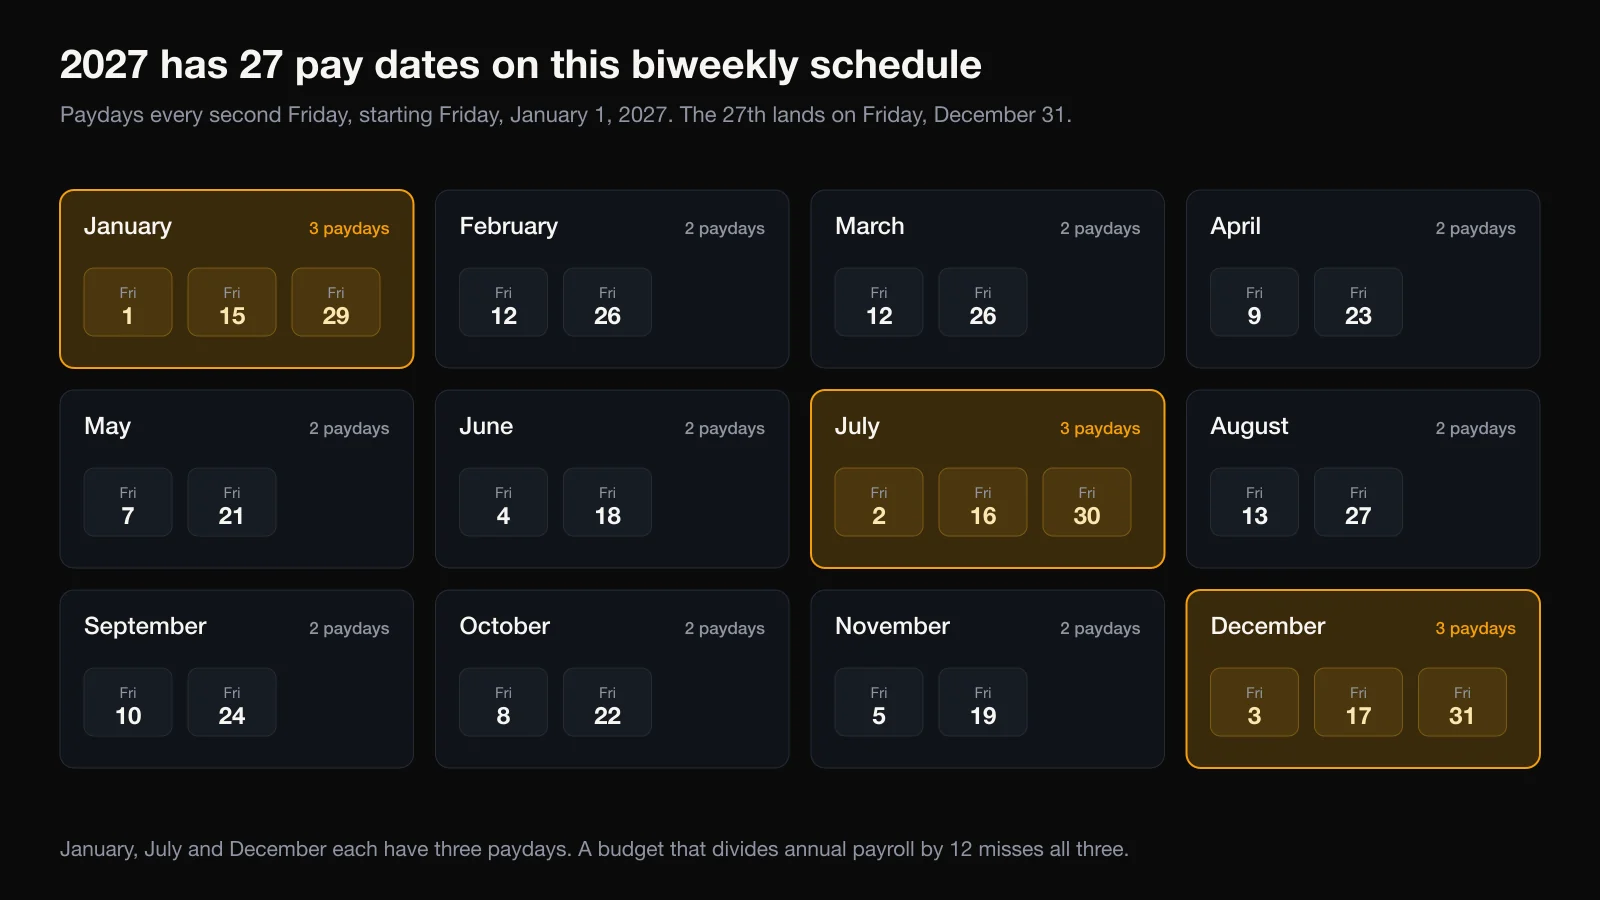
- Enter payroll on its real pay dates. In Bureau of Labor Statistics data for February 2023, biweekly was the most common pay period, used by an estimated 43.0 percent of US private establishments. A biweekly payroll hits every other column, not a smooth amount in each.
- Enter annual and quarterly items in their own week: insurance, software renewals, and tax. For estimated tax, the IRS divides the year into four payment periods, each with its own due date.
- Leave a cell at zero when nothing moves that week. Do not spread a monthly bill across four columns.
To place pay dates correctly, including months with three paydays, use the free payroll calendar calculator.
Worked Example: A Quarter That Ends Fine and Two Weeks That Do Not
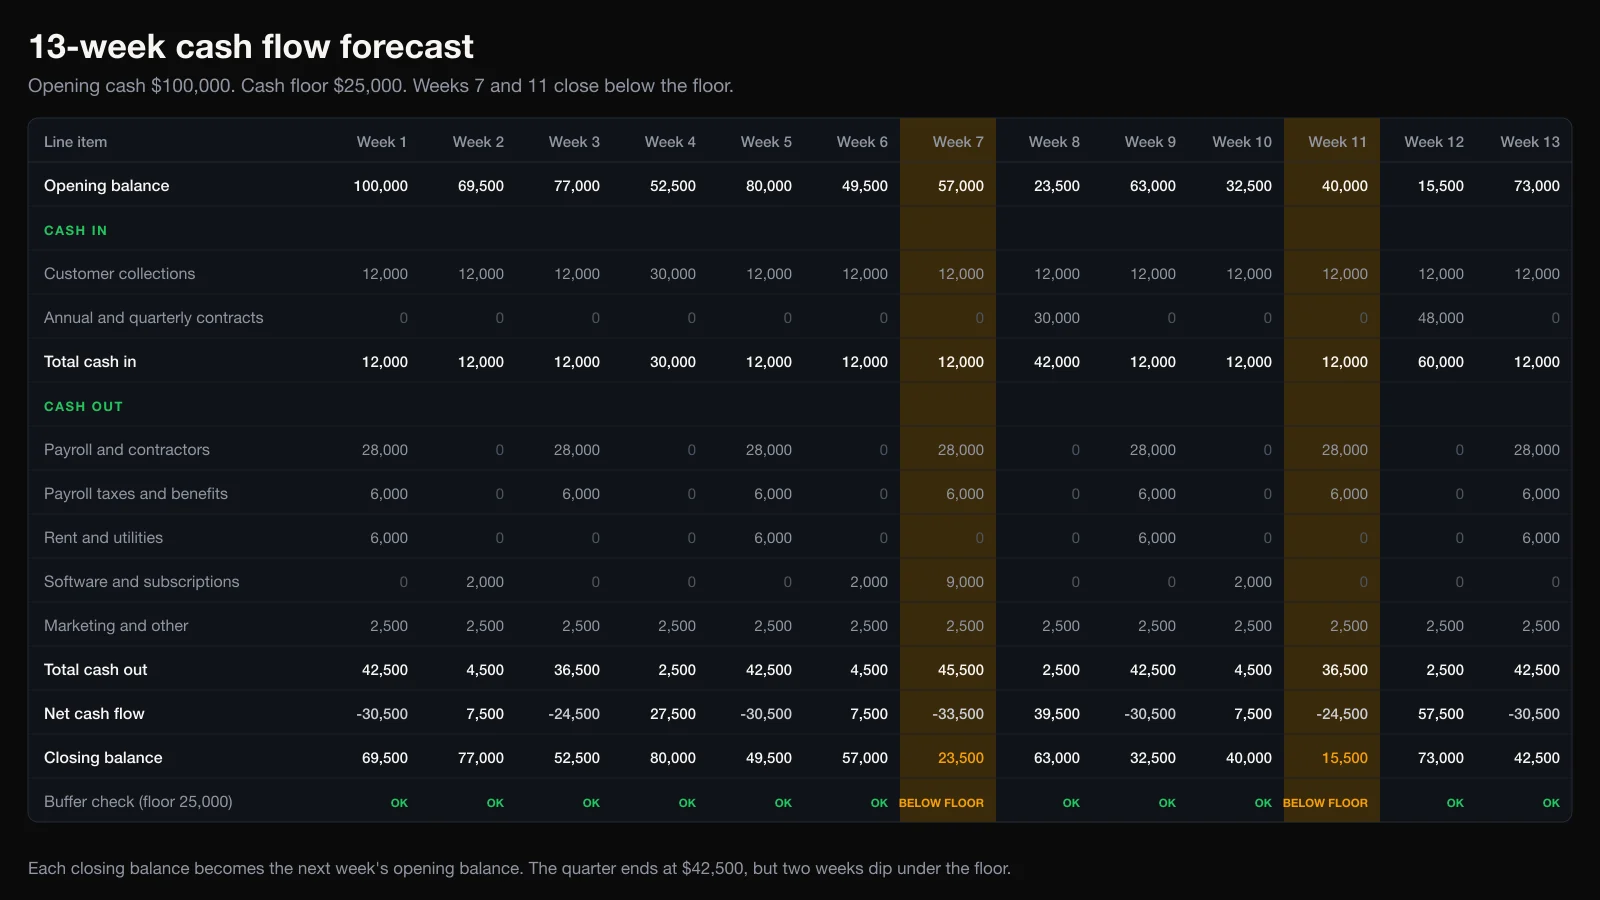
Here is the sheet filled in for a company that opens the quarter with $100,000 and sets a cash floor of $25,000.
The inputs:
- customer collections of $12,000 a week, plus one $18,000 invoice paid in week 4
- a $30,000 quarterly contract payment in week 8 and a $48,000 annual renewal in week 12
- payroll of $28,000 and payroll taxes and benefits of $6,000 every two weeks, starting in week 1
- rent and utilities of $6,000 in weeks 1, 5, 9, and 13
- software of $2,000 in weeks 2, 6, and 10, plus a $9,000 annual renewal in week 7
- marketing of $1,500 and other outflows of $1,000 every week
| Week | Net cash flow | Closing balance | Check |
|---|---|---|---|
| 1 | -$30,500 | $69,500 | OK |
| 2 | $7,500 | $77,000 | OK |
| 3 | -$24,500 | $52,500 | OK |
| 4 | $27,500 | $80,000 | OK |
| 5 | -$30,500 | $49,500 | OK |
| 6 | $7,500 | $57,000 | OK |
| 7 | -$33,500 | $23,500 | Below floor |
| 8 | $39,500 | $63,000 | OK |
| 9 | -$30,500 | $32,500 | OK |
| 10 | $7,500 | $40,000 | OK |
| 11 | -$24,500 | $15,500 | Below floor |
| 12 | $57,500 | $73,000 | OK |
| 13 | -$30,500 | $42,500 | OK |
What the Sheet Shows
Over the quarter the company collects $252,000 and spends $309,500. It ends with $42,500, comfortably above its floor. A monthly summary would stop there.
The weekly view does not. Week 7 closes at $23,500, because a payroll run and a $9,000 software renewal land in the same week, one week before the quarterly contract pays. Week 11 closes at $15,500, one week before the annual renewal arrives.
Neither week runs out of cash. Both break the rule the company set for itself, and it can see that 6 and 10 weeks ahead.
What to Do About It
Two changes clear both weeks:
- Pay the $9,000 software renewal in week 8 instead of week 7. Week 7 then closes at $32,500.
- Ask the annual customer to pay in week 11 instead of week 12. Week 11 then closes at $63,500.
The quarter still ends at $42,500. Nothing was cut and nothing was earned. Only the timing moved, which is the whole point of forecasting by week. For the same idea applied to the date cash reaches zero, see zero cash date.
How Do You Keep the Forecast Rolling?
Update the sheet once a week, on the same day.
The weekly routine:
- Replace last week's forecast amounts with what actually cleared the bank.
- Check the closing balance against your real bank balance. If they differ, find the missing item before you go on.
- Move the week that ended out of the sheet, shift the remaining weeks left, and add a new week 13.
- Type your real bank balance as the new week 1 opening balance.
- Review any payment that has slipped, and move it to the week you now expect it.
- Read the check row. Act on the first week marked BELOW FLOOR.
The second item is the one people skip. A forecast that is never compared with the bank drifts, and a drifting forecast is worse than none because it is trusted.
What Are the Common Mistakes?
Five mistakes account for most broken 13-week forecasts:
- Entering revenue when it is invoiced or recognized, not when it is paid. ARR vs cash explains why the two disagree.
- Averaging payroll across weeks. See will I make payroll for the pay-date method.
- Typing a number over a formula. Once a closing balance is typed in, the chain is broken and every later week is wrong without showing it.
- Leaving out annual and quarterly payments because they are not in this month's bills.
- Building the sheet once and not updating it.
When Does a Spreadsheet Stop Being Enough?
A spreadsheet is the right place to start. It costs nothing, and building it by hand teaches you where your cash actually goes.
It starts to strain when:
- updating it from bank and accounting exports takes more than an hour a week
- more than one person edits it
- you want to test a hire, a lost customer, or a price change without copying the file
- you only find out a week is below the floor when you next open the sheet
That is the work Zensus takes over. It reads bank transactions through Plaid, invoices and bills from QuickBooks, and invoices and subscriptions from HubSpot, and keeps a 13-week view current without exports. You can ask what-if questions in plain English, and a Slack alert fires when the 30-day projection drops below the cash floor you set. Plans are on the pricing page.
If you are not there yet, the template and the free runway calculator will take you a long way.