The Problem with "Everything's Fine on Paper"
Here's a scenario we've all seen:
Your business is growing. Sales are up 30% year-over-year. Your customers are profitable. Everything looks great on the income statement.
But then you check your bank account and wonder how the hell you're supposed to pay this month's payroll.
This isn't a cash flow problem. It's a timing problem.
You probably pay your suppliers in 30 days. Your customers pay you in 45. That 15-day gap adds up when you have to fund inventory, cover payroll, handle unexpected repairs, or invest in new equipment.
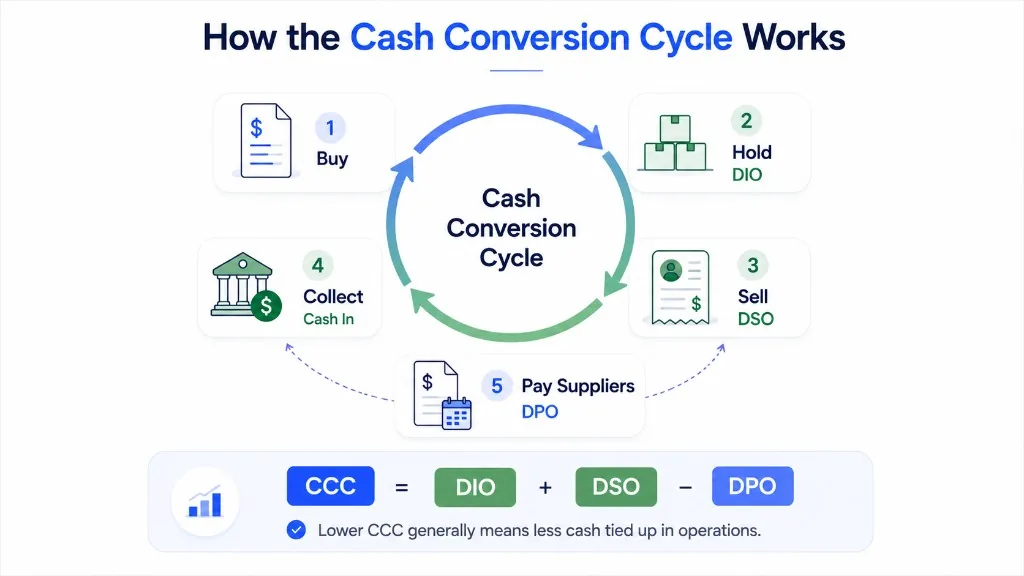
The cash conversion cycle (CCC) measures exactly this: how long it takes your cash to complete the loop from paying suppliers → holding inventory → getting paid by customers → cash in the bank.
Think of it as your business's working capital heartbeat.
The CCC Formula (Yes, It's Simple)
CCC = DIO + DSO − DPO
Or spelled out:
Cash Conversion Cycle = Days Inventory Outstanding + Days Sales Outstanding − Days Payable Outstanding
Where:
- DIO = How many days it takes to sell your inventory
- DSO = How many days it takes to collect from customers
- DPO = How many days you get to wait before paying suppliers
A lower CCC means your cash moves faster through the system. But here's what most people get wrong: CCC is an average, not a crystal ball.
A 45-day CCC doesn't mean "my cash comes back in exactly 45 days." It means on average, your business ties up cash for 45 days before it returns.
Your actual bank balance on any given week depends on the specific dates your customers pay you and you pay your vendors. That's why I always pair CCC analysis with a 13-week cash flow forecast.
Let's Work Through a Real Example
Imagine a hypothetical manufacturer that sells physical products.
The Starting Point: What the Manufacturer Has
| Item | Beginning Balance | Ending Balance |
|---|---|---|
| Inventory | $80,000 | $120,000 |
| Accounts Receivable | $100,000 | $140,000 |
| Accounts Payable | $80,000 | $100,000 |
From their income statement:
- Annual credit sales: $1,095,000
- Annual COGS: $730,000
Step 1: Calculate Averages
For accounts, we average the beginning and ending balances:
- Average inventory: ($80,000 + $120,000) ÷ 2 = $100,000
- Average A/R: ($100,000 + $140,000) ÷ 2 = $120,000
- Average A/P: ($80,000 + $100,000) ÷ 2 = $90,000
Step 2: Calculate Each Component
Now we apply the formulas. I'm using 365 days for this annual calculation.
| Metric | Formula | Calculation | Result |
|---|---|---|---|
| DIO | Avg Inventory ÷ COGS × 365 | $100,000 ÷ $730,000 × 365 | 50 days |
| DSO | Avg A/R ÷ Credit Sales × 365 | $120,000 ÷ $1,095,000 × 365 | 40 days |
| DPO | Avg A/P ÷ COGS × 365 | $90,000 ÷ $730,000 × 365 | 45 days |
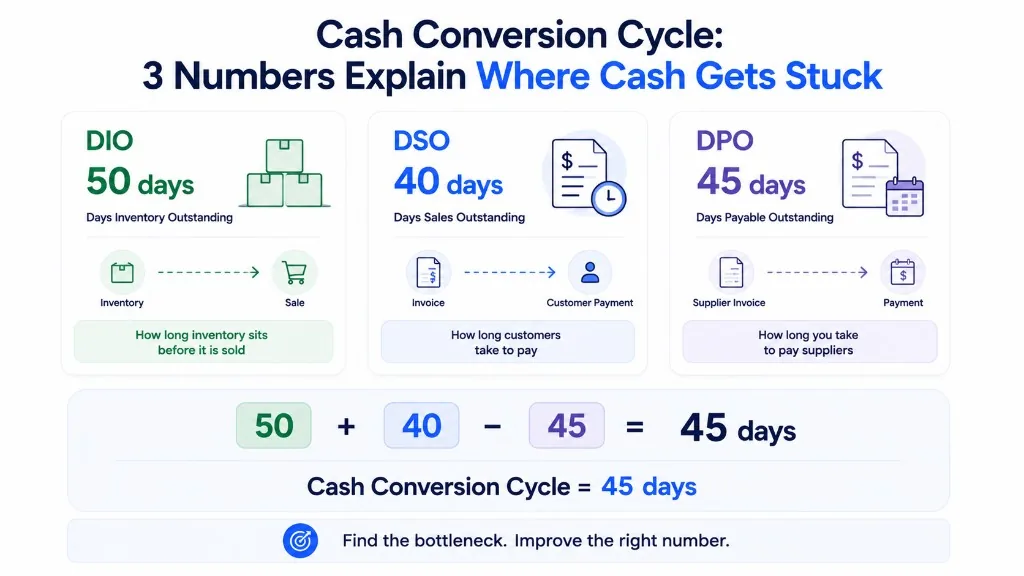
| CCC | DIO + DSO − DPO | 50 + 40 − 45 | 45 days |
What This Means
The manufacturer has a 45-day cash conversion cycle. Here's how to read that:
- They keep inventory for 50 days before selling
- Customers take 40 days to pay
- But they can keep their suppliers' money for 45 days
- Net result: cash is tied up for 45 days
So in this business, supplier financing is offsetting about half of their operating cycle. That's actually pretty decent.
The "Same CCC, Different Problems" Trap
Two companies can have exactly the same 45-day CCC but very different operational headaches.
| Metric | Company A | Company B |
|---|---|---|
| DIO | 50 days | 10 days |
| DSO | 40 days | 80 days |
| DPO | 45 days | 45 days |
| CCC | 45 days | 45 days |
Company A's CCC is 45 days because they're holding too much inventory. Their cash is stuck in stock on the warehouse floor.
Company B's CCC is 45 days because they're not collecting from customers fast enough. Their cash is stuck in receivables.
Same CCC number. Completely different problems.
The takeaway: Don't just obsess over the total CCC. Look at which component is dragging you down, because the fix might be very different for each.
DIO vs DSO vs DPO: The Breakdown
Let's go deeper into each component.
DIO: Days Inventory Outstanding
Formula:
DIO = Average Inventory ÷ COGS × Days in Period
This tells you how long, on average, inventory sits before it sells.
Why it matters: High DIO means money tied up in unsold stock, whether that's excess purchasing, weak demand forecasts, or slow-moving products. Low DIO is good, but don't understock to cut it; you'll lose sales.
Watch out: A super-low DIO could mean you're not carrying enough stock, which leads to angry customers and lost revenue. Balance is key.
DSO: Days Sales Outstanding
Formula:
DSO = Average Trade A/R ÷ Net Credit Sales × Days in Period
This measures how long it takes customers to pay you.
Why it matters: A high DSO means your cash is working for someone else. Every day customers delay payment, that's a day longer your cash is stuck in receivables instead of being available for payroll, vendors, or growth.
Pro tip: Use net credit sales (not total sales) in the denominator if you have cash and credit sales. If you can't split out cash and credit sales, just use total sales as an approximation.
DPO: Days Payable Outstanding
Formula:
DPO = Average Trade A/P ÷ COGS or Purchases × Days in Period
This tells you how long it takes to pay your suppliers.
Why it matters: This is your supplier financing. You get the goods, sell them, get paid by customers, and then pay suppliers. If you pay vendors in 45 days, your suppliers are financing you for 45 days.
Important: Don't just dump all your liabilities into A/P. Only include trade accounts payable (money owed to suppliers for inventory/purchases). Payroll, taxes, and loans are different buckets.
The catch: You can't ethically or practically pay invoices 90 days late when your contract says 30. Negotiate longer terms, don't break relationships.
CCC vs. Operating Cycle: What's the Difference?
People mix these up. Here's the distinction:
| Metric | Formula | What It Captures |
|---|---|---|
| Operating Cycle | DIO + DSO | Time from buying inventory to collecting cash |
| Cash Conversion Cycle | DIO + DSO − DPO | Net time cash is tied up (includes supplier credit) |
Think of it as gross vs net:
- Operating cycle = your business's full operating loop (gross)
- CCC = operating cycle minus the supplier credit you're "renting" (net)
If your DPO is 45 days and your operating cycle is 90 days, you get a 45-day CCC. The supplier is effectively funding about half your working capital needs.
What Is a "Good" CCC?
Honestly? There's no universal answer.
A grocery store that sells fresh produce in 2 days has a totally different working capital model than a manufacturer producing complex equipment that sits in inventory for 90 days.
Instead of fixating on some magic number, ask:
- Trend: Is our CCC improving or getting worse over time?
- Comparables: How do we stack up against truly similar businesses?
- Component diagnosis: If CCC is high, which part is driving it?
- Sustainability: Are we improving terms responsibly, or just stretching suppliers?
- Cash impact: How does this affect our actual bank balance?
For most founders: Compare to your own historical numbers first. If your CCC goes from 30 to 50 days, investigate, regardless of whether 30 or 50 "should" be acceptable in isolation.
Negative CCC: Friend or Foe?
A negative CCC occurs when DPO > (DIO + DSO). In plain English: your customers are paying you before you need to pay your suppliers.
Good negative CCC: Customers prepay, or you negotiate favorable terms. Bad negative CCC: You're paying suppliers late.
For example:
- Company X: DIO = 20 days, DSO = 5 days, DPO = 40 days → CCC = −15 days
- They collect from customers quickly and let suppliers wait 40 days
Red flag: If DPO is high because you're overdue to your suppliers, that's not a competitive advantage. That's a relationship and cash flow crisis waiting to happen.
A negative CCC can look pretty on paper while hiding serious working capital stress. Always check why you're in negative territory.
How to Actually Improve Your CCC
You have three levers to pull. Here's where to start depending on what's broken.
1. Reduce DSO: Get Paid Faster (Low-Hanging Fruit)
Collections are usually the fastest, cheapest way to improve cash.
Start with your A/R aging:
| Bucket | Amount |
|---|---|
| 0–30 days | $X |
| 31–60 days | $Y |
| 61+ days | $Z |
Find out why: Late invoicing? Billing errors? Disputed charges? Missing PO numbers?
Then take action:
- Invoice immediately after delivery or milestone completion
- Confirm billing contacts and PO requirements upfront
- Offer multiple payment options (ACH, card, wire, invoice terms)
- Automate payment reminders before and after due dates
- Review overdue accounts weekly, not quarterly
- For large B2B clients, discuss term reduction during quarterly reviews
Example: A $10,000/day sales business where DSO goes from 30 to 45 days = ~$150,000 more cash tied up.
2. Reduce DIO: Stop Overstocking
Excess inventory is expensive: both the money you spent and the ongoing carrying costs.
Diagnose first:
| Metric | What to check |
|---|---|
| Turnover | Are some items barely selling? |
| Age | Do we have 6+ month old stock? |
| Value | How much is this SKU worth? |
| Margin | Are we overbuying low-margin items? |
Then fix:
- Tighten reorder points to actual demand, not "gut feel"
- Stop buying safety stock that's never been needed
- Clear obsolete inventory (discount, donate, liquidate)
- Align purchasing with confirmed demand, especially in volatile markets
- Review supplier lead times; JIT makes sense for fast movers
Balance: Don't understock to chase low DIO. Stockouts have real costs: lost sales, customer churn, and opportunity costs.
3. Improve DPO: Use Supplier Financing (Carefully)
Supplier credit is like free money. But you can't abuse it.
Smart DPO improvement:
- Negotiate longer terms (e.g., 30 → 45 → 60 days)
- Bundle purchases to justify longer payment cycles
- Take early-pay discounts when you have the cash. It lowers DPO, but a good discount can beat the extra days.
- Stagger vendor payments to match collection dates
What NOT to do: Systematically pay everyone 2x as late as your contract allows. That will kill relationships, and suppliers will either stop shipping or start billing you penalties.
Example: Switching from Net 30 to Net 60 on your top 5 suppliers might give you meaningful cash relief without burning bridges.
CCC vs. Cash Flow Forecast: Two Different Tools
This is critical for founders. A cash flow forecast and the CCC answer different questions.
| Tool | What It Does | What It Doesn't Tell You |
|---|---|---|
| CCC | Average working capital timing over a period | Exact dates of cash inflows/outflows |
| 13-Week Forecast | Week-by-week cash in and out | Long-term average efficiency |
Why you need both:
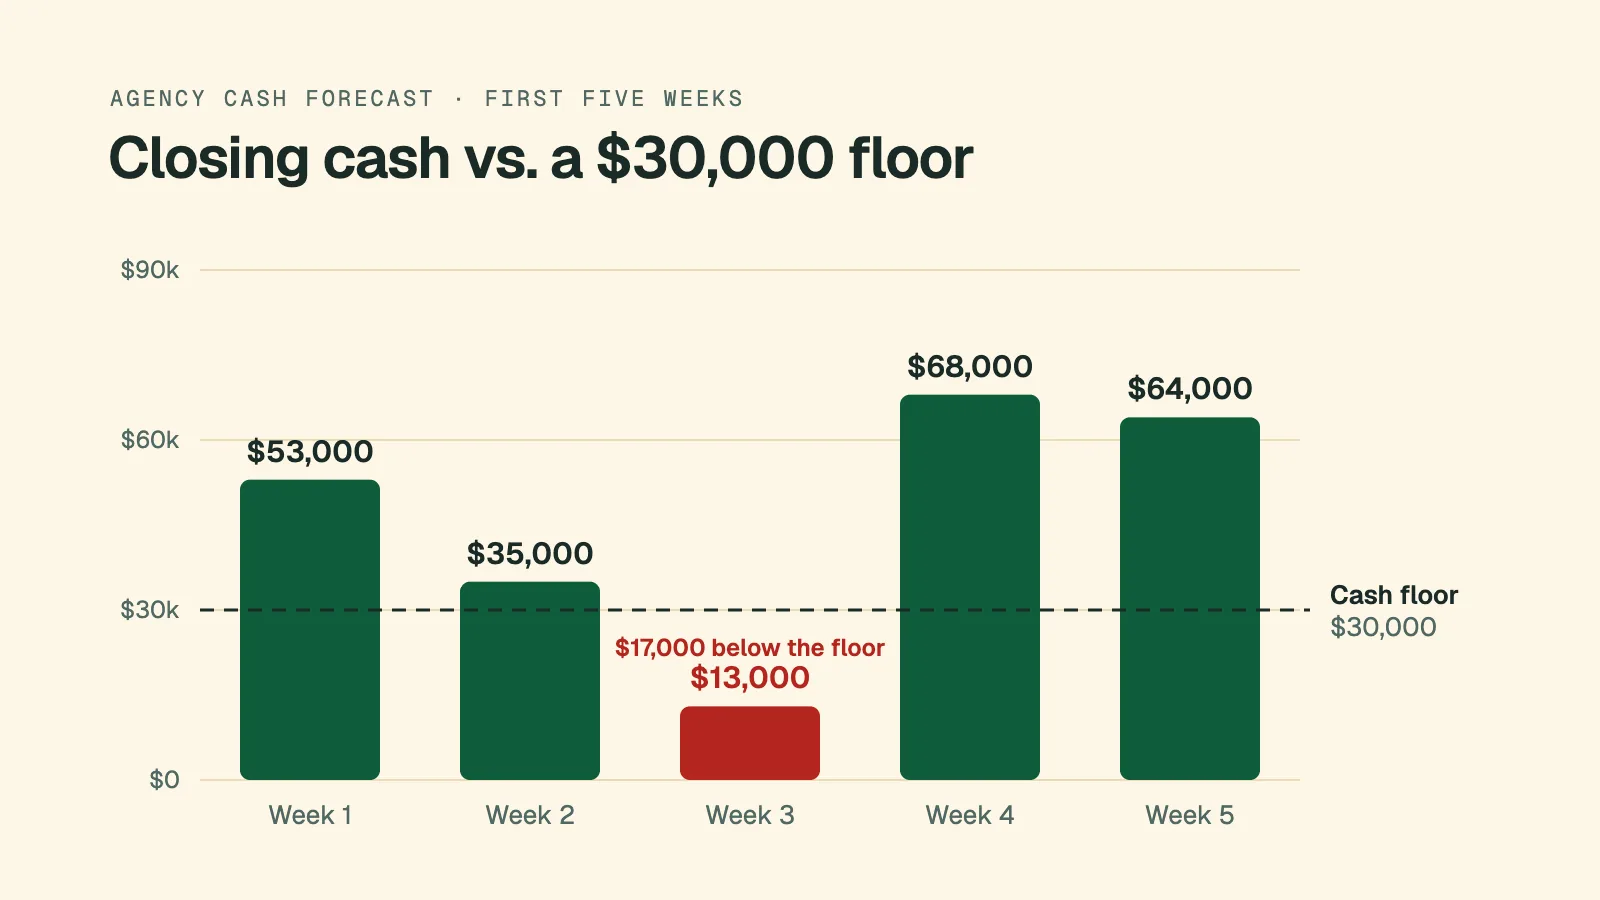
CCC tells you "on average, my cash turns over every 45 days." A cash forecast tells you "I'll run out of cash in Week 4."
Example:
- You have a 45-day CCC
- Your biggest customer pays $150,000 in Week 5 instead of Week 3
- You go into Week 4 with $25,000 in the bank
- You need to pay $80,000 payroll in Week 4
- Your bank balance hits negative $55,000 in Week 4
Same CCC. Different cash reality because of timing.
This is why I always build a 13-week cash flow forecast after diagnosing CCC issues.
The DSO Delay Calculator (Quick Math)
If you're curious how much cash a collections delay eats:
Additional A/R = Daily credit sales × days of delay
For a company with $3,650,000 annual credit sales (~$10,000/day):
| Scenario | DSO | Approx. A/R |
|---|---|---|
| On-time | 40 days | $400,000 |
| Delayed | 55 days | $550,000 |
Extra cash tied up: $150,000
That's ~$10,000 × 15 extra days. Not $150,000 that disappears, but $150,000 that's stuck in receivables, unavailable for payroll, investments, or growth.
It's a steady-state cash burden, not a one-time event.
CCC for SaaS, Agencies, and Non-Inventory Businesses
The traditional CCC formula was built for inventory businesses. It doesn't always work for others.
SaaS (Software as a Service)
Most SaaS has no physical inventory, so DIO is zero or irrelevant.
But wait, what about annual subscriptions?
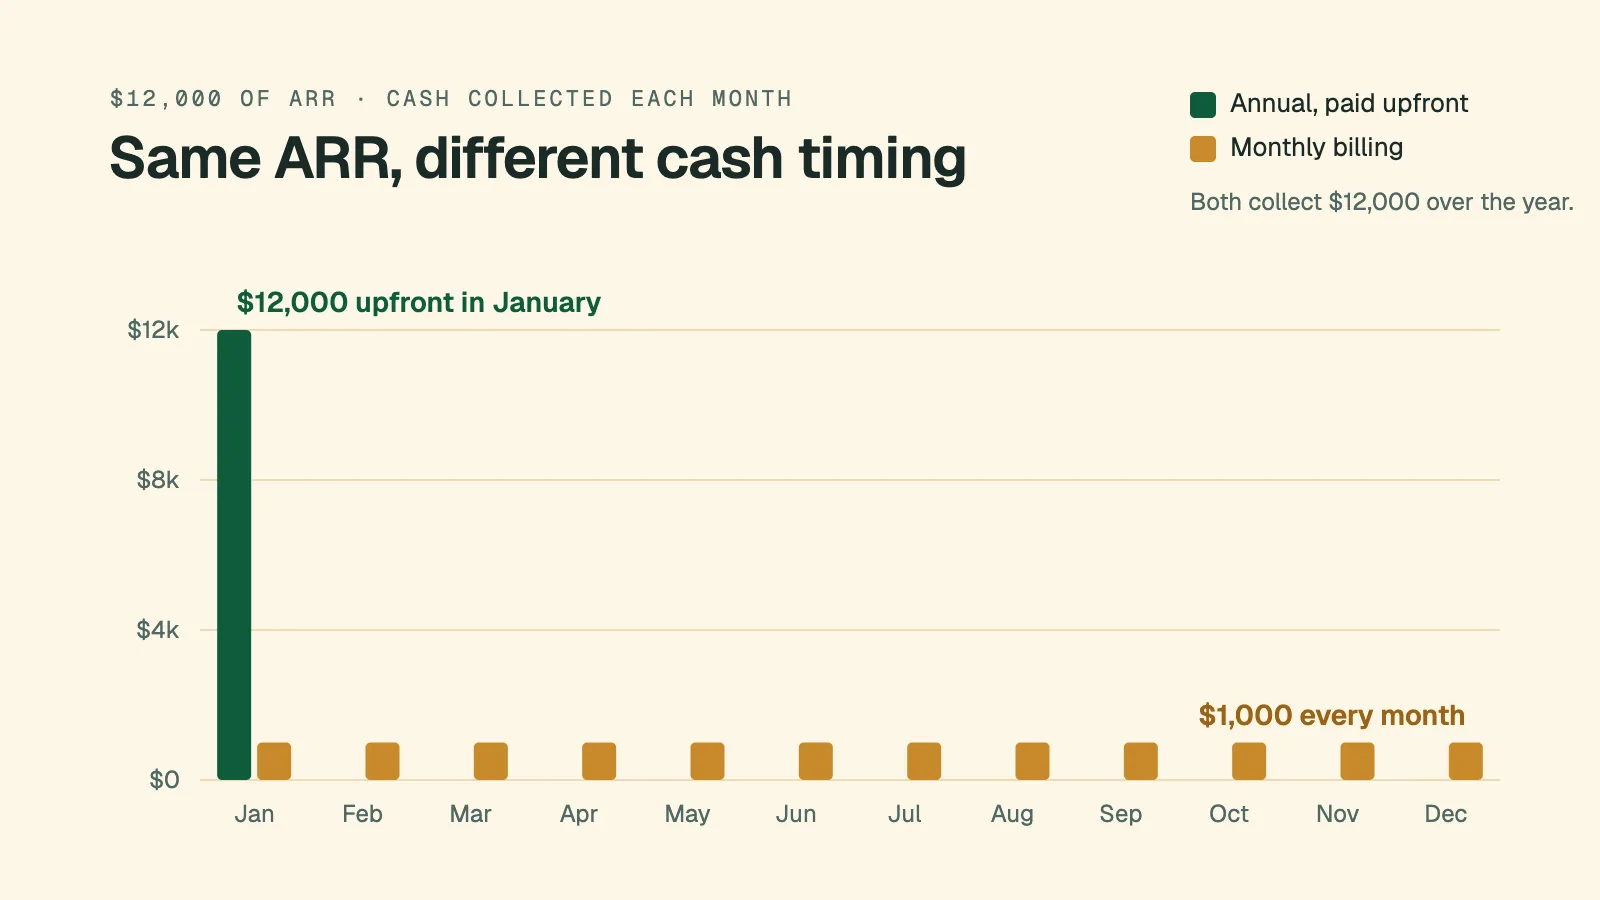
A customer pays $12,000 upfront for a 12-month subscription, but the company recognizes $1,000 in revenue per month. The upfront cash helps, but the traditional CCC formula can be misleading.
Better metrics for SaaS:
- Days to subscription collection (from contract to first payment)
- Average accounts receivable
- Deferred revenue
- Cash runway
- Monthly burn rate
Agencies and Service Businesses
Agencies may not have inventory at all. Their main costs are payroll, contractors, and software subscriptions.
What to track instead:
- DSO (still matters: when clients pay you)
- Days to first major cost payment (payroll, hosting, software)
- Contract milestone timing
- Accounts receivable
- Cash runway vs. obligations
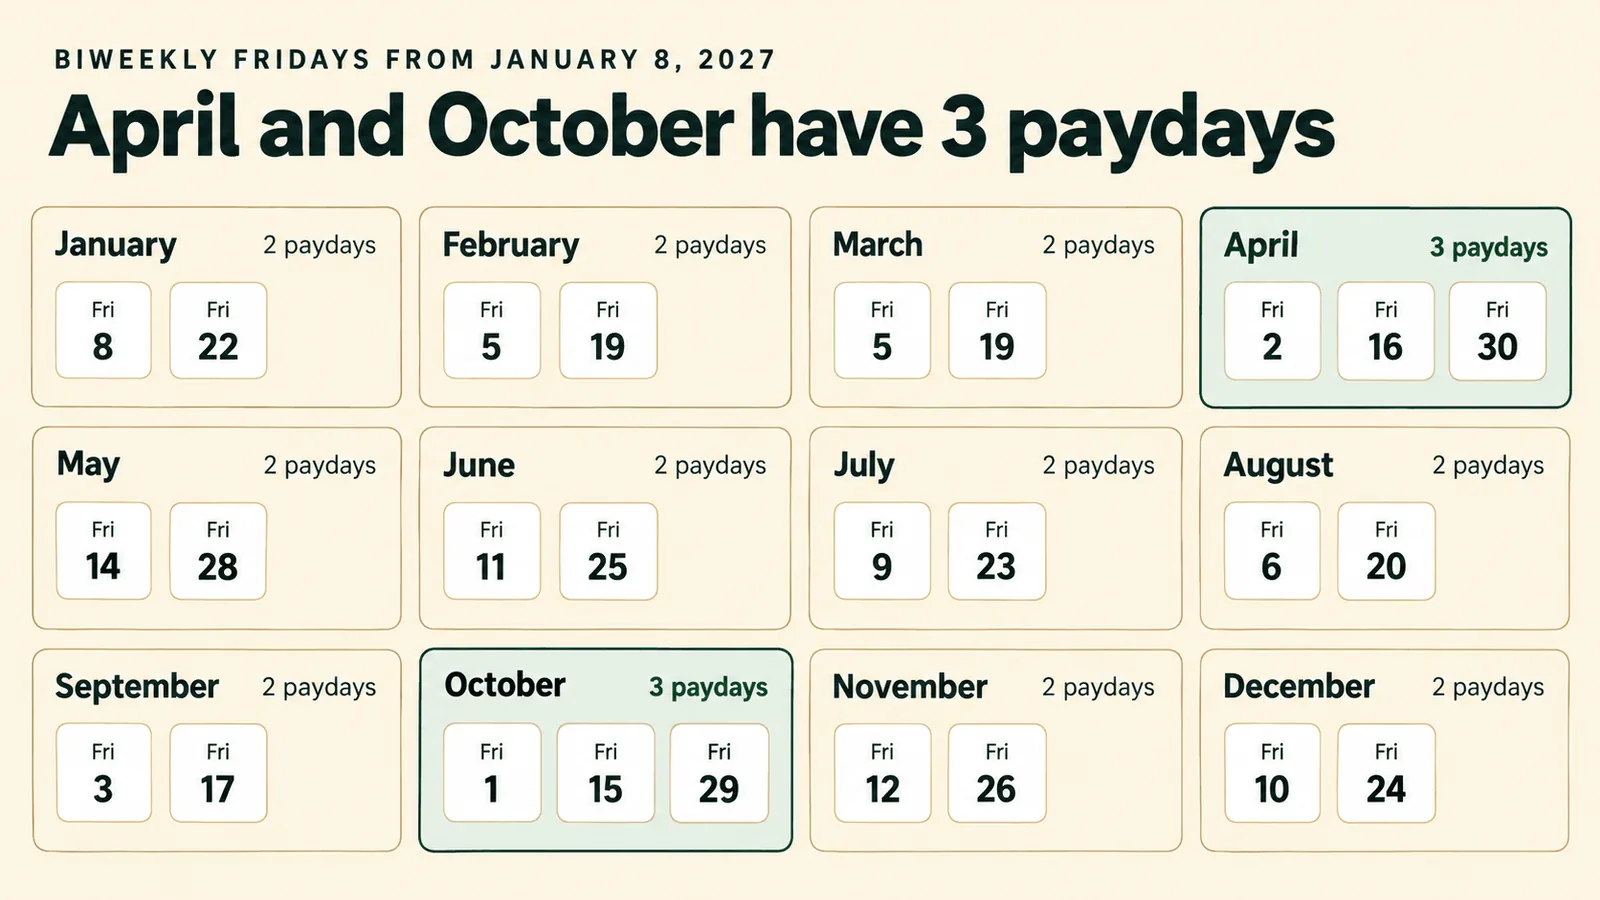
Example: You complete work on March 15, invoice the client on April 5, and they pay on May 5. Meanwhile, you pay payroll on March 31. That's a cash gap, not a CCC gap.
Ecommerce
The traditional CCC model works well for inventory-based ecommerce.
You buy inventory → hold it → sell it → get paid → pay suppliers.
The same three metrics (DIO, DSO, DPO) are highly relevant.
Do I Need a CCC Calculator?
You can calculate it in a spreadsheet. Here's a simple layout:
| Input | Where to find it |
|---|---|
| Beginning inventory | Balance sheet (start of period) |
| Ending inventory | Balance sheet (end of period) |
| Beginning trade A/R | Balance sheet (start of period) |
| Ending trade A/R | Balance sheet (end of period) |
| Beginning trade A/P | Balance sheet (start of period) |
| Ending trade A/P | Balance sheet (end of period) |
| Credit sales | Income statement or A/R ledger |
| COGS/Purchases | Income statement or purchase records |
| Days in period | 365 (annual) or actual days (quarter) |
Formulas:
Average Balance = (Beginning + Ending) ÷ 2
DIO = Average Inventory ÷ COGS × Days in Period
DSO = Average A/R ÷ Credit Sales × Days in Period
DPO = Average A/P ÷ COGS (or Purchases) × Days in Period
CCC = DIO + DSO − DPO
Simple Excel:
| Cell | Label | Formula |
|---|---|---|
| B2 | Days in period | 365 |
| B3 | Beginning inventory | (enter) |
| B4 | Ending inventory | (enter) |
| B5 | Beginning A/R | (enter) |
| B6 | Ending A/R | (enter) |
| B7 | Beginning A/P | (enter) |
| B8 | Ending A/P | (enter) |
| B9 | Credit sales | (enter) |
| B10 | COGS | (enter) |
| B12 | DIO | =AVERAGE(B3:B4)/ |
| B13 | DSO | =AVERAGE(B5:B6)/ |
| B14 | DPO | =AVERAGE(B7:B8)/ |
| B15 | CCC | =B12+B13-B14 |
Caveats:
- Ensure COGS/Purchases match the inventory/payables you're measuring
- Average balances work best for stable businesses; monthly snapshots may be needed for seasonal operations
- Don't include non-trade items (taxes, payroll, loans) in A/P
The Bottom Line
The cash conversion cycle gives you a practical lens into working capital efficiency.
You can calculate it in minutes using your balance sheet and income statement. You can spot whether inventory, collections, or supplier terms are your biggest cash drag.
But here's what I can't overstate: CCC is not your crystal ball.
It tells you the average timing of cash tied up in operations. It doesn't tell you the exact week you'll run out of cash.
For actual cash planning: Build a 13-week cash flow forecast.
For performance tracking: Monitor CCC trends quarter over quarter.
For strategy: Use CCC analysis to decide which working capital levers to pull first, and whether they're actually improving cash or just moving the problem around.
Because in the end, it's not about optimizing an accounting formula. It's about knowing when your cash will run out and having a plan before that day hits.
Got questions about applying this to your specific situation? Book a cash flow forecasting consultation or check out our 13-week cash flow Excel template to start planning.
Note: All examples and calculations in this post are hypothetical and for educational purposes only.