Here's something I keep coming back to when I work with founders and finance teams: you can be profitable and still run out of cash.
I've seen this more times than I'd like. The company reports great revenue, positive margins, strong EBITDA... and then payroll check day hits like an unexpected bill.
Why does this happen? Timing.
Customers pay on day 45 instead of the promised 30. Supplier invoices land in a week where no collections came in. Multiple large payments stack in the same week.
A monthly P&L might show you're profitable. Your month-end cash balance looks fine. But at the start of week three? You're staring at a payroll you can't afford.
This is what a 13-week cash flow forecast fixes.
It's not about being wrong. It's about being right at the wrong time. Instead of waiting until month-end to discover your cash problem, a 13-week forecast lets you see it coming and take action while you still have options.
The Short Answer
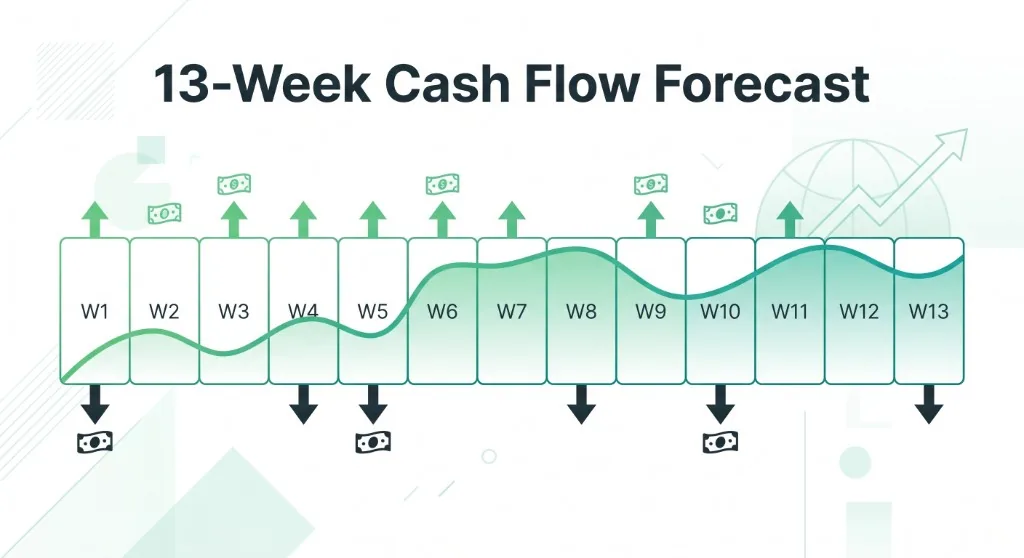
A 13-week cash flow forecast is a rolling, week-by-week projection of the cash you expect to receive and pay over the next 91 days.
You start with what's actually in the bank, add what you expect to collect, subtract what you expect to pay, and calculate the closing balance each week. It's a direct-method model: not derived from your P&L, not based on accounting profit. It's real cash moving in and out.
The forecast rolls forward: every week, you replace that week's projection with what actually happened and add a new week for the future. So you're always looking at the next 13 weeks, not a fixed quarterly forecast that nobody reads.
What's Actually Inside a 13-Week Forecast
Let's talk about what the model actually tracks. Four lines, that's it:
1. Opening Cash
This is the cash you have at the start of the week. But here's where people mess it up: make sure it's cash that's actually available to spend.
I worked with a company a few years ago that showed $200,000 on the balance sheet. $150,000 was tied up in accounts that couldn't be accessed. Their "forecast" started from a fantasy opening balance and never got accurate.
2. Cash Inflows
Here's my pet peeve: an invoice is not cash.
If you bill a customer $50,000 on the 1st of the month and they pay on the 30th, you don't get cash on day 15 because that's what "terms" say. You get it on day 30.
Your forecast should track when cash actually hits the bank, not when you recognize the revenue on your P&L. If your typical customers are 21 days late on invoices (and they're not going to magically change their behavior), build that into the forecast.
3. Cash Outflows
Payroll. Rent. Vendor invoices. Taxes. Capital expenditures. Everything that leaves the bank.
Here's another one I see a lot: people who take a $10,000/month utility bill and pretend it's $2,500/week for the whole month because it's "simpler" in the spreadsheet.
That's your cash flow forecast, not your P&L. Don't smooth payments across weeks unless that's how the payments actually happen.
4. Closing Cash
What you have left at the end of the week after all the inflows and outflows. That's your ending balance, which becomes next week's opening.
The formula is embarrassingly simple:
Closing Cash = Opening Cash + Cash Inflows - Cash Outflows
Why 13 Weeks? Why Not Monthly?
Because 13 weeks is 91 days, which is roughly a quarter.
I used to argue for monthly forecasts until I realized what I was doing wrong.
Consider this scenario I've walked through with clients:
| Week | Opening | In | Out | Closing |
|---|---|---|---|---|
| Week 1 | $50,000 | $10,000 | $25,000 | $35,000 |
| Week 2 | $35,000 | $2,000 | $30,000 | $7,000 |
| Week 3 | $7,000 | $35,000 | $15,000 | $27,000 |
| Week 4 | $27,000 | $8,000 | $5,000 | $30,000 |
Month-end says you're sitting at $30,000. Looks healthy, right?
But week two, you're at $7,000. If you need $10,000 as your operating floor, you're already $3,000 under by week two.
By the time you look at month-end, you were below your floor two weeks ago. And week two may be when payroll is due.
Monthly forecasts are good for quarterly budgeting. They're terrible for operational cash management.
Here's What a 13-Week Forecast Actually Looks Like
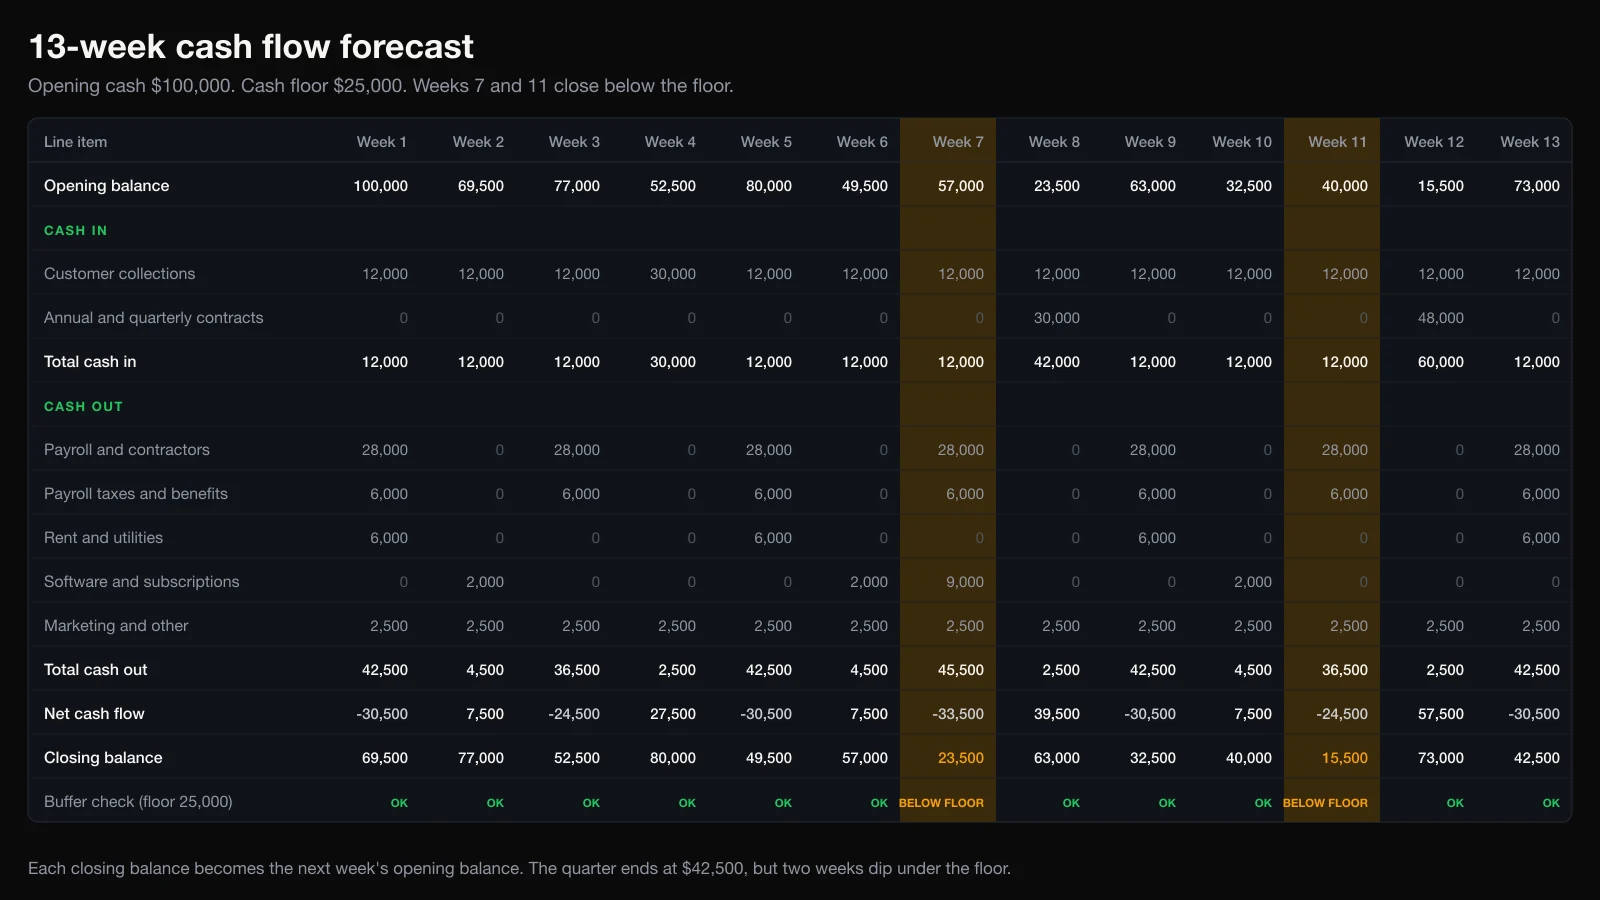
Let's walk through a real-ish example. This is a hypothetical SaaS startup, all numbers are made up, but the dynamics are real:
Starting position: $100,000 in the bank. Minimum cash floor: $40,000.
| Week | Opening | Cash In | Cash Out | Closing |
|---|---|---|---|---|
| 1 | $100,000 | $20,000 | $25,000 | $95,000 |
| 2 | $95,000 | $15,000 | $30,000 | $80,000 |
| 3 | $80,000 | $20,000 | $25,000 | $75,000 |
| 4 | $75,000 | $10,000 | $30,000 | $55,000 |
| 5 | $55,000 | $15,000 | $35,000 | $35,000 |
| 6 | $35,000 | $50,000 | $25,000 | $60,000 |
| 7 | $60,000 | $20,000 | $30,000 | $50,000 |
| 8 | $50,000 | $15,000 | $25,000 | $40,000 |
| 9 | $40,000 | $40,000 | $30,000 | $50,000 |
| 10 | $50,000 | $15,000 | $25,000 | $40,000 |
| 11 | $40,000 | $30,000 | $20,000 | $50,000 |
| 12 | $50,000 | $25,000 | $20,000 | $55,000 |
| 13 | $55,000 | $45,000 | $20,000 | $80,000 |
What does this tell us?
- Total receipts: $320,000
- Total payments: $340,000
- Net change over 13 weeks: -$20,000
- Week 13 closing balance: $80,000
On paper, everything looks fine. We're down $20,000 from where we started, but we'll have $80,000 at quarter-end.
Here's the catch: Week 5 drops to $35,000, which is $5,000 below our $40,000 operating floor.
If we'd only been looking at the month-end or week-13 number, we would have thought we're perfectly fine. But in week five, we're already below the line we defined as "safe."
That's the whole point: the 13-week forecast exposes problems that a monthly snapshot completely hides.
So What Do You Actually Do With This?
A forecast doesn't solve cash problems. It tells you what you might face so you can act while you still have options.
In this example, we had to decide what to do before week five. Options we considered:
- Could we get a key client to pay now? They were already 40 days late on invoices.
- Could we delay that equipment purchase we were supposed to make this month?
- Should we access our short-term credit line now, before we actually hit the floor?
The beauty of a rolling 13-week forecast: You make these decisions at weeks one, two, or three, not three days before you're underwater.
Rolling Forecasts: Why This Matters
A static 13-week forecast is kind of a joke. You build it, file it away, and nobody touches it again until March.
A rolling forecast lives.
Every week, the process is:
- Take what you forecasted for that week and compare it to what actually happened
- If there's a big variance, ask why
- Remove that week from the forecast
- Add a new 13th week with updated assumptions
Why did that customer pay 10 days late this week? Should we adjust their expected payment dates for the next few weeks? Did we overspend on one expense? Should we reduce our assumptions going forward?
This isn't just bookkeeping. It's your rhythm of running the business. You're learning from last week's data to make better assumptions next week.
This Is Not Your Budget
I see this all the time: people calling a cash flow forecast a "budget" because it's time-based.
No. They're different animals.
| 13-Week Forecast | Budget | P&L | |
|---|---|---|---|
| Purpose | What cash will we have available? | What do we plan to earn/ | What did we actually earn/ |
| Time horizon | Next 13 weeks, rolling forward | Annual (or 3–5 year) | Historical |
| Basis | Cash basis: when money moves | Accrual basis: when it's earned/ | Accrual basis |
| When it matters | Payroll, vendor payments, runway decisions | Strategic planning, investor reporting | Performance evaluation, tax purposes |
A company can be massively profitable on paper and still go cash-broke because receivables are clogged up and customers are holding their money.
A 13-week forecast doesn't tell you if you're profitable. It tells you if you'll have cash to operate this week and next.
The Cash Floor: What This Actually Means
Let me be clear: a positive ending balance doesn't mean you're fine.
I worked with a company that had this scenario:
| Week | Closing |
|---|---|
| 1–4 | Healthy balances |
| Week 5 | Below floor |
| 6 | Strong recovery |
| 7–13 | Comfortable buffer |
Month-end: $120,000. They're confident. The CFO says, "We're in great shape."
Week five: the forecast shows they can't cover payroll with the cash in the bank. It would have been a disaster.
The forecast caught this because we were looking at the cash floor, not just the ending balance.
Define what "safe" means for your business. Is it 4 weeks of operating expenses? Is it $75,000 because you know the next big expense is in two weeks? That's your floor.
Then check which week first dips below it. That's your warning. That's when you need to act.
Where Does This Fit in the Finance Ops World?
Here's how I position this:
A 13-week cash flow forecast is your tactical cash management tool.
It's not your board presentation material.
It's not your investor deck.
It's your day-to-day navigation system for cash.
For Founders
You probably care about:
- Will we hit payroll?
- How much runway do we actually have?
- When should we start fundraising?
- Can we afford this new hire?
A 13-week forecast answers these. It tells you whether that hire in six weeks breaks your cash floor, when you should start a fundraising roadshow, whether that equipment purchase is affordable.
For Finance Teams
You're probably:
- Building monthly forecasts
- Trying to explain to leadership why cash is lower than the P&L suggested
- Preparing materials for a board meeting
- Managing working capital
A 13-week forecast gives you the data to tell a better story than "we're down $15,000 from where we said we'd be."
Now you can say: "We had this collection that was due on day 12, but they paid on day 28. That timing shift is costing us 16 days of operating cash."
For SaaS
Listen, I work with a lot of SaaS companies. Here's what you need to know:
If a customer pays $30,000 per year upfront, that's $30,000 in cash in the first month. But only 1/12 of that revenue per month on the P&L.
Your forecast should show that big cash hit. Your P&L should recognize it gradually.
Don't forecast ARR as a cash receipt unless you've been paid.
Same with deferred revenue. It's a liability on the balance sheet, not cash on hand. The cash already hit the bank (if it was prepaid).
A Few Real Mistakes I See
Let me be direct because I want you to actually use this.
Mistake #1: Using Contract Terms Instead of Actual Behavior
You've been working with your customers for two years, and every single one of them pays 12–15 days late. Your contract says "net 30."
Build the forecast based on how they've actually paid, not what the contract says.
Historical behavior is more predictable than contractual promises.
Mistake #2: Forgetting About Timing
Monthly utilities are $3,000. People who put $750/week for 4 weeks have smooth cash flow in their forecast.
Don't do this. If the bill comes on the 10th, that's the week. Full $3,000 out in one week.
Mistake #3: Building a Forecast in June and Not Touching It Again
Here's something I've already said, and I'm going to say it again: A forecast that isn't updated isn't a forecast.
It's a museum exhibit.
Your assumptions change. New customers, new vendors, new pricing, new team members. If your forecast hasn't been updated in 3 months, it's more fiction than fact.
Mistake #4: Weekly Totals Don't Tell You Everything
The closing cash balance for week six might be $150,000. But if the most important payroll is Wednesday and a big vendor payment hits on Monday, you still have a cash problem on that day.
For critical payments, you need a daily view.
I've seen founders go from $150,000 in the bank at the end of the week to running out of cash on Wednesday, because payroll went out before the week's collections came in.
Mistake #5: The Spreadsheet Trap
A 13-week forecast in a spreadsheet can work great for a while. But when you're pulling data from five different systems, manually entering payments from PDFs, and having three different versions floating around... that's when you need better tools.
You don't need software when your process is broken. You need software when you can't maintain your process.
Start simple, stay consistent, and let the data quality be the constraint that pushes you toward automation.
Is This Really Worth the Effort?
Let me tell you about a company I worked with last year.
They had $48,000 in cash at month-end. They were profitable. They felt confident.
By week six, their 13-week forecast showed them at $5,000 with a $20,000 minimum floor.
They acted. They:
- Called a key client to explain the situation and get a partial early payment
- Deferred a planned $15,000 server upgrade
- Arranged a 60-day credit line to cover payroll in the tight week
They avoided a cash crisis that would have cost them probably $50,000+ in emergency capital and burned a lot of founder relationships.
A simple 13-week forecast saved them a potentially disastrous situation.
Bottom Line
Here's what I want you to walk away with:
- Start simple. Google Sheets, 13 weeks, four columns. Don't overthink it.
- Be consistent. Update it every week. If you're doing it once a quarter, you're not really doing it.
- Define a cash floor. Know what "safe" means for your business.
- Watch the lowest balance, not just the end. That's where the risk is.
- Compare forecast to actuals. The variance is where you learn.
- Don't confuse profit with cash. This is why you need both.
- Keep it rolling. The forecast from last week feeds into this week.
- It's not about being right. It's about being early.
The point of a 13-week cash flow forecast is anticipation, not prediction.
You're not trying to nail every dollar. You're trying to have enough cash on hand when it counts.
Start with the next 13 weeks. Update every Friday. Watch the floor.
If you find yourself spending more time wrestling with the model than thinking about your business, you're asking for better tools. But don't buy software to escape work. Buy software to do the work once and have it done.
Want to see how to build one in Excel? Read our step-by-step guide here.
Ready to use one instead? Download the free template here.
Want to know how long your cash will actually last? Check out our zero-cash date guide.
Related guides:
- What is cash flow forecasting?: the basics this model builds on.
- Will I make payroll?: checking each payroll date against your cash.
- Cash flow early warning system: setting a cash floor and alerts.
- ARR vs cash: why annual contracts and the bank balance disagree.