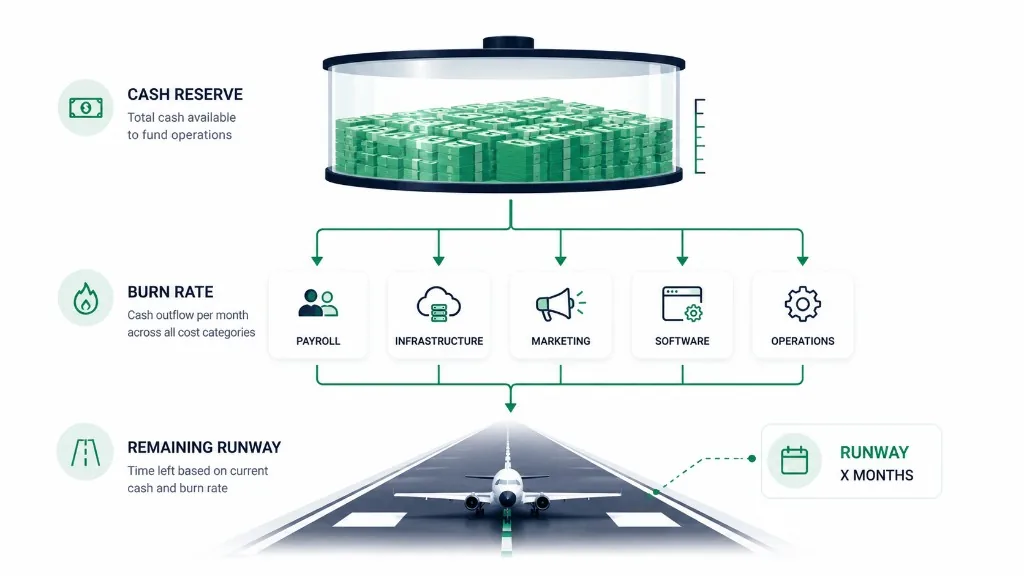
So here's the thing that got me thinking a lot as a founder: AI compute costs can quietly become one of the largest variable expenses in an AI startup.
I used to think, you know, it's just a few cents per API call. Nothing to worry about. But then you build a feature that costs, say, five cents per user per month in development, and suddenly when thousands of customers start using it, that becomes three hundred dollars per month. Add in agent workflows, retries, retrieval systems, and larger context windows, and your infrastructure bill can grow way faster than your revenue.
The challenge is not just figuring out what one API call costs. It's really about understanding what your entire product will cost to operate as usage scales and how those costs affect your gross margins, cash flow, and runway.
To forecast AI compute costs, you need to estimate how frequently each AI workload runs, calculate its cost using the relevant model and infrastructure prices, then project those costs across expected customer usage. Finally, you need to map vendor billing and payment dates into your cash flow forecast.
This guide walks through the formulas, examples, scenarios, and financial decisions founders need to make in 2026.
What Counts as AI Compute Cost?
AI compute costs include the expenses associated with running artificial intelligence workloads in production.
For a startup building on large language models, those costs often extend beyond just the model itself. Here's what I've found when breaking it down:
| Cost category | What you're paying for | Common billing unit |
|---|---|---|
| Model inference | Processing prompts and generating responses | Input/output tokens |
| Prompt caching | Writing or reusing cached context | Cached tokens |
| GPU infrastructure | Hosting or serving models on rented compute | Instance-hours |
| Embeddings | Converting text or other content into vectors | Tokens or operations |
| Vector database | Storing and retrieving embeddings | Storage, queries, capacity |
| Agent tools | Search, code execution, third-party actions | Operations or API calls |
| Multimodal processing | Audio, images, and video | Tokens, duration, images, or other units |
| Observability | Traces, logs, and model usage monitoring | Events, storage, or volume |
Not every AI product incurs all these expenses.
A basic chatbot calling a managed model API might primarily pay for input and output tokens. An autonomous research agent could incur additional costs for search, retrieval, multiple model calls, and tool execution.
A startup hosting its own model may instead pay for GPU instances, storage, deployment infrastructure, and related operations.
The first rule of AI cost forecasting is to model the architecture you actually operate, not a generic industry average.
AI Compute Cost Forecast Formula
The foundation of an accurate forecast is workload volume multiplied by the cost of executing each workload.
For a managed text-model API, a simplified formula is:
Model API cost = (uncached input tokens × input rate + cached input tokens × cache-read rate + cache-write tokens × cache-write rate + output tokens × output rate) ÷ 1,000,000
Add any separately billed operations, tools, media processing, or supporting infrastructure.
The formula assumes that token prices are quoted in dollars per million tokens. Each provider's billing categories and rate rules must be checked independently.
For example, OpenAI and Anthropic document different prices for different token categories and model configurations:
Pricing-reference check: October 29, 2026. Current account-specific rates, model versions, service tiers, and regional charges should always be verified before budgeting.
There are a few important distinctions you need to know:
- Input tokens and output tokens may have different prices.
- Cached tokens may qualify for separate rates.
- Cache creation and cache reads can have different economics.
- Reasoning tokens may be included in billed output usage depending on the model.
- Long-context requests and processing modes may change applicable rates.
- Separately billed tools should not be assumed to be included in the token price.
Do not count cached tokens again as uncached input. Likewise, do not count an API charge and an equivalent self-hosted GPU charge for the same workload unless the architecture genuinely uses both.
With these rules established, you can calculate the cost of an individual AI request.
How to Calculate AI Inference Cost per Request
Imagine your startup operates an AI assistant that processes customer financial data.
A typical request contains:
- 4,000 input tokens
- 1,000 output tokens
- No caching
- No tool calls or retries
For illustration, assume the model charges:
- $1 per million input tokens
- $5 per million output tokens
These are hypothetical rates, not quotations for any particular provider or model.
Step 1: Calculate input cost
Input cost = (4,000 ÷ 1,000,000) × $1
Input cost = $0.004
Step 2: Calculate output cost
Output cost = (1,000 ÷ 1,000,000) × $5
Output cost = $0.005
Step 3: Calculate total cost
Total request cost = $0.004 + $0.005
Cost per request = $0.009
That is nine-tenths of one cent per request.
It sounds inexpensive. But look at how the cost changes with usage.
| Monthly requests | Cost per request | Monthly API cost |
|---|---|---|
| 1,000 | $0.009 | $9 |
| 10,000 | $0.009 | $90 |
| 50,000 | $0.009 | $450 |
| 100,000 | $0.009 | $900 |
| 1,000,000 | $0.009 | $9,000 |
This calculation assumes every request has exactly the same workload, price, and token consumption.
Real production traffic rarely behaves that way. Some customers send longer prompts, request more detailed answers, or trigger additional processing.
That is why founders need to forecast costs at the workload and customer level.
How to Forecast Monthly AI Costs from Users and Features
A startup does not grow in API requests alone.
It grows in customers, product features, and the frequency with which people use those features.
A useful monthly forecast begins with:
Monthly workload cost = active users × tasks per user × average cost per task
For workloads with multiple calls, expand the formula:
Monthly model cost = active users × completed tasks per user × expected model calls per task × weighted cost per call
Then account for retries, unsuccessful tasks, and other attributable expenses without counting any workload twice.
Example: Forecasting AI costs for 1,000 users
Suppose your product has:
- 1,000 monthly active users
- 50 AI requests per active user
- $0.009 model cost per request
- No additional agent calls or retries
Monthly requests:
1,000 × 50 = 50,000
Monthly model cost:
50,000 × $0.009 = $450
Now imagine those same users trigger three model calls per task rather than one.
Monthly calls:
1,000 × 50 × 3 = 150,000
Monthly model cost:
150,000 × $0.009 = $1,350
Your customer count has not changed. Your pricing has not changed.
But your AI inference bill has tripled because the architecture performs more work per task.
Forecast by feature, not just total traffic
Consider a startup offering three AI capabilities.
| Feature | Monthly executions | Model cost per execution | Monthly cost |
|---|---|---|---|
| Document summary | 20,000 | $0.009 | $180 |
| Financial analysis | 10,000 | $0.027 | $270 |
| Advanced research | 2,000 | $0.090 | $180 |
| Total | 32,000 | $630 |
These are illustrative workload costs, excluding supporting infrastructure.
The advanced research feature represents a small percentage of activity but contributes a meaningful share of compute spending.
That matters when you are deciding which features belong in each pricing tier.
A $19 subscription with unlimited access to expensive workflows can have very different economics from a subscription with usage-based limits.
Account for model mix
Many AI products use more than one model.
A lightweight model might classify requests or extract structured information, while a more capable model handles complex reasoning or difficult customer tasks.
Instead of forecasting one average token price for every request, forecast the workload mix.
For each feature, record the model used, average token consumption, expected request count, cache behavior, and observed failure rates.
Then sum costs across the models.
This creates a forecast that can adapt when you change routing logic or introduce a new feature.
Why AI Agent Workflows Can Cost More Than One Model Call
An AI agent is not necessarily a single inference request.
A customer might ask an agent to analyze a company's financial health.
To complete the task, the system may:
- Retrieve relevant financial information.
- Call a model to interpret the data.
- Execute a calculation or query.
- Call another model to evaluate the result.
- Generate a final customer-facing explanation.
Each stage can introduce additional model or tool charges.
Suppose an agent completes one task using three model calls, each costing $0.009.
Cost per successful task:
3 × $0.009 = $0.027
At 10,000 completed tasks per month:
10,000 × $0.027 = $270
But this estimate assumes every attempt succeeds without extra work.
Production agents may encounter malformed tool results, timeouts, repeated reasoning loops, or retries.
Measure cost per successful task
One of the most useful metrics for agentic products is:
AI cost per successful task = total attributable AI workload spending ÷ successfully completed tasks
For example, suppose a workflow completes 10,000 tasks but consumes $330 across all successful and failed attempts.
Its effective cost per successful task is:
$330 ÷ 10,000 = $0.033
This is higher than the ideal $0.027 because the numerator includes additional work.
Track both the average and the expensive outliers.
For agentic products, monitoring the 95th-percentile task cost can reveal workflows that occasionally consume far more resources than expected.
Tools such as Langfuse document methods for tracking model usage and attributing costs to requests and traces.
The objective is not merely to know what your provider charged last month. It is to understand which features, customers, and workflow behaviors created that charge.
API Pricing vs. Self-Hosted GPU Costs
Managed APIs and self-hosted models have fundamentally different cost structures.
With a managed API, you often pay according to consumption: tokens, requests, processing modes, and separately billed tools.
With self-hosting, you pay for the infrastructure used to operate the model even during periods when capacity is underutilized.
Managed API model
A simplified estimate is:
Monthly API cost = request volume × weighted cost per request
Additional infrastructure or minimum charges are modeled separately.
Self-hosted GPU model
A simplified infrastructure estimate is:
Monthly GPU cost = provisioned GPU-instance hours × effective instance-hour price
Then add relevant storage, network, orchestration, monitoring, support, and operational costs.
For example, suppose an illustrative GPU instance costs $2 per hour and operates continuously for a 30-day month.
720 hours × $2 = $1,440 per month
This is hypothetical pricing. Actual instance cost varies by hardware, provider, region, contract, and configuration.
The GPU bill exists whether the model processes a large volume of requests or spends much of its time idle.
Utilization changes the economics
Suppose the infrastructure costs $1,440 per month and successfully serves:
- 100,000 requests: $0.0144 per request in GPU rental alone.
- 500,000 requests: $0.00288 per request in GPU rental alone.
Neither number includes additional operating costs, and neither guarantees equivalent model quality or latency.
Before comparing API and self-hosted economics, founders should measure throughput, GPU utilization, concurrency, uptime, memory requirements, latency targets, and capacity headroom.
Compare the total cost of serving equivalent workloads at equivalent reliability and quality, not merely the advertised GPU hourly rate against the cheapest API token rate.
See AWS EC2 GPU instance options and EC2 On-Demand pricing for examples of instance-based billing.
Hidden AI Costs Founders Often Overlook
Model inference is only one component of the cost of an AI product.
Depending on your architecture, the complete budget may include several additional expenses.
Retrieval-augmented generation
Retrieval-augmented generation (RAG) systems retrieve relevant information before the model produces an answer.
A RAG pipeline can incur costs for document processing, embeddings, vector storage, retrieval operations, and model inference.
Some of those costs occur during ingestion, while others scale with ongoing user activity.
Track them separately so that one-time document processing does not distort the recurring cost of answering user questions.
Tools and external services
Agents may use web search, browser services, code execution, external data providers, or specialized APIs.
These services can have their own billing methods.
A model call that costs less than a cent may still trigger a separately billed operation.
Observability and storage
Logs, traces, outputs, and debugging data may create storage and monitoring expenses.
These costs matter especially when applications record large volumes of execution traces or process sensitive business documents.
Prepaid credits and commitments
Startup cloud credits and prepaid API balances can reduce immediate cash outflows.
But they do not necessarily eliminate the economic cost of the workload.
Track credits separately from gross usage and estimate when balances will be exhausted.
A company that spends $4,000 per month in AI services while consuming credits may face a sudden cash-payment increase when those credits expire or run out.
A forecast should show both the cost of operating the product and the actual cash required to pay providers.
AI Cost per Customer, Gross Margin, and Revenue Ratio
Compute forecasting becomes a financial management tool when you connect workloads to customer revenue.
Three metrics are especially useful.
1. AI cost per customer
AI cost per customer = attributable AI spending ÷ relevant customer count
You can calculate this across the customer base, but segment-level analysis is more informative.
A high-usage enterprise customer may consume far more AI resources than a small customer.
Averages can hide customers whose service costs exceed the revenue they generate.
2. AI inference cost as a percentage of revenue
Inference-to-revenue ratio = attributable inference cost ÷ revenue for the same period
Suppose monthly recognized revenue is $20,000 and model inference costs are $3,000.
$3,000 ÷ $20,000 = 15%
That means model inference alone consumes 15 cents of every recognized revenue dollar.
There is no universal inference-to-revenue ratio that every AI startup should target.
Appropriate ratios depend on product architecture, pricing, market, customer behavior, and the company's stage.
A startup may set an internal operating target, but that target should not be mistaken for an industry benchmark.
3. Gross margin
Gross margin considers a broader set of direct costs.
Gross margin = (revenue − cost of goods sold) ÷ revenue
Consider this hypothetical monthly income statement:
| Metric | Amount |
|---|---|
| Recognized revenue | $20,000 |
| Model inference | $3,000 |
| Retrieval, storage, and serving infrastructure | $1,000 |
| Other direct service costs | $2,000 |
| Total modeled cost of goods sold | $6,000 |
| Gross profit | $14,000 |
| Gross margin | 70% |
The inference-to-revenue ratio is 15%.
The total direct-cost ratio is 30%.
The gross margin is 70%.
These metrics describe different aspects of the business.
For a contribution-margin analysis, founders may additionally allocate variable expenses such as payment processing, customer-specific support, or other costs, depending on their chosen definition.
Use consistent accounting treatment and disclose what is included.
The right question is not whether AI companies universally have lower margins than traditional software companies.
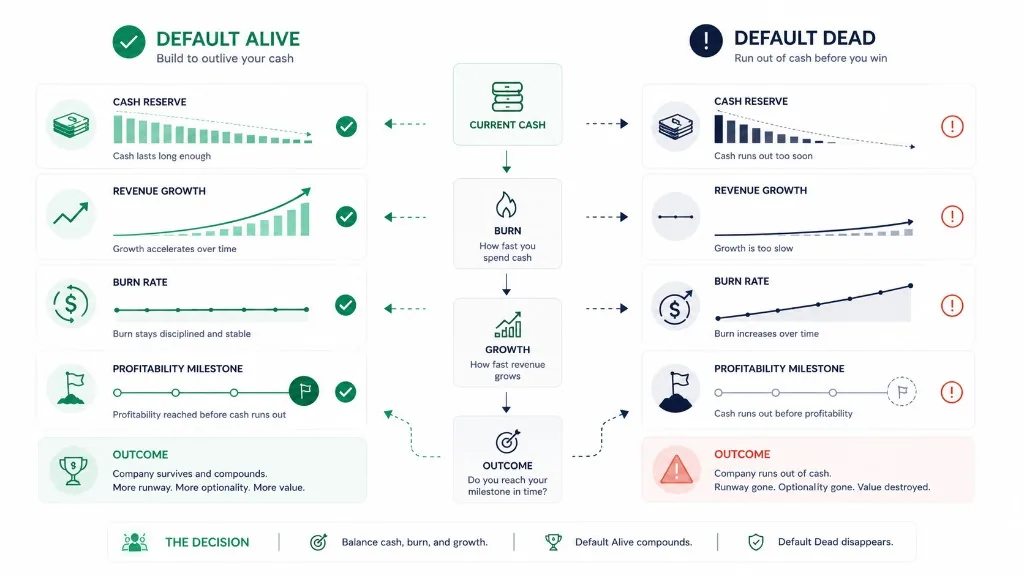
It is whether your product can serve its customers at a sustainable margin, and whether that margin improves or deteriorates as usage increases.
Why Falling Token Prices Do Not Guarantee Lower AI Bills
Lower model prices do not automatically mean lower total AI spending.
Your actual bill depends on three interacting variables:
Total AI cost = usage volume × workload intensity × effective unit price
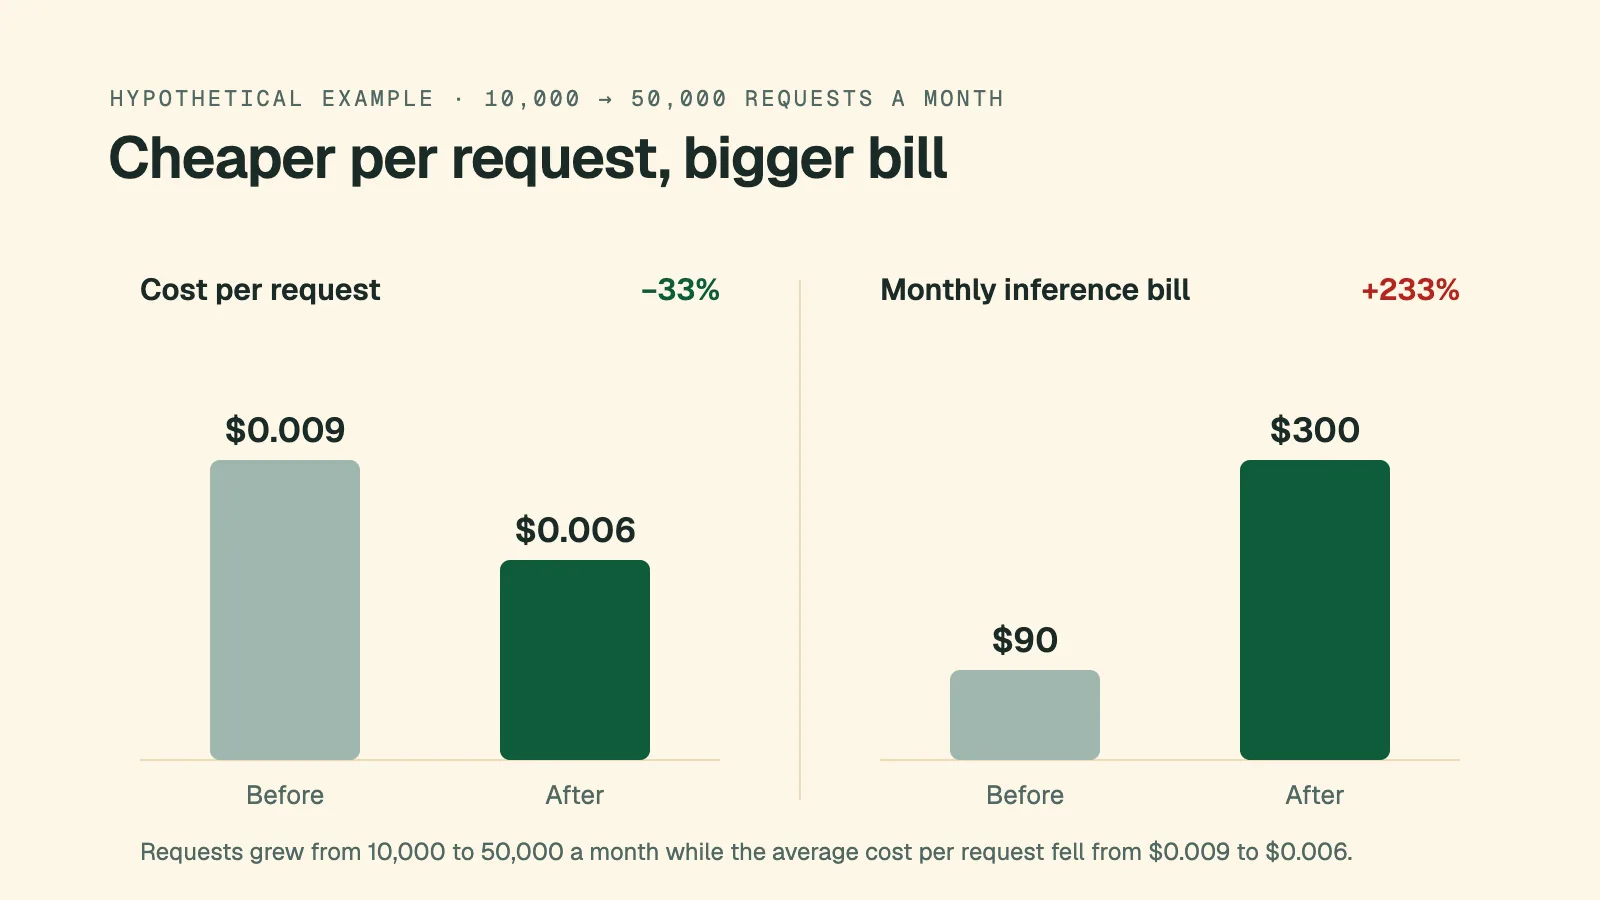
Suppose your startup initially processes 10,000 monthly requests at an average of $0.009 each.
Monthly spending = $90
Later, you optimize the system, reducing the average cost to $0.006 per request.
That is a 33.3% reduction in unit cost.
But over the same period, monthly request volume increases to 50,000.
New monthly spending:
50,000 × $0.006 = $300
| Metric | Before | After |
|---|---|---|
| Requests per month | 10,000 | 50,000 |
| Average cost per request | $0.009 | $0.006 |
| Monthly inference cost | $90 | $300 |
Your unit cost improved, but your total spending increased by 233.3%.
This is not necessarily a problem.
If revenue is growing faster than AI costs, the company may be strengthening its economics.
The risk occurs when users consume more compute without generating proportionate revenue.
That is why your financial model should forecast request volumes, token intensity, customer growth, and prices separately.
Base, Upside, and Downside AI Compute Scenarios
A single-point estimate cannot represent the range of outcomes for a growing AI startup.
Instead, build scenarios that answer different operating questions.
Consider this hypothetical monthly forecast, starting from the same simplified $0.009 cost per model call in the base case:
| Assumption | Base | Upside | Downside |
|---|---|---|---|
| Active users | 1,000 | 1,500 | 800 |
| Tasks per user/month | 50 | 60 | 70 |
| Calls per task | 2 | 2 | 4 |
| Cost per call | $0.009 | $0.007 | $0.012 |
| Monthly model cost | $900 | $1,260 | $2,688 |
The upside scenario assumes faster customer growth alongside better unit efficiency.
The downside scenario assumes fewer customers but substantially more expensive workloads.
These numbers are illustrative and exclude non-model costs.
Notice that a company can spend more even with fewer customers.
That's the danger of assuming compute expenses always scale directly with revenue.
What should founders stress-test?
Build independent assumptions for user growth, task frequency, average input and output tokens, model routing, caching effectiveness, agent steps, retries, and provider prices.
Change one variable at a time to identify the largest cost driver.
Then combine realistic variables into scenarios.
A useful forecast lets you ask:
- What happens if active users double?
- What if larger customer documents increase input tokens by 40%?
- What if we move expensive tasks to a cheaper model?
- What if an agent takes twice as many steps?
- What if credits expire sooner than expected?
The purpose of scenario planning is not to predict one exact bill. It is to identify which operating decisions would materially change your costs.
How to Put AI Compute Bills Into a 13-Week Cash Flow Forecast
This is where many otherwise detailed compute forecasts become incomplete.
Your startup can correctly estimate a $3,000 AI bill and still forecast its bank balance incorrectly.
Why?
Because the date you consume compute is not necessarily the date cash leaves your bank account.
Example: November usage, December payment
Suppose an AI startup incurs $3,000 in model and infrastructure expenses during November.
Its provider issues an invoice in early December.
The company pays on December 8.
Economically, the company consumed $3,000 of services in November.
But the bank account does not decrease by that $3,000 until December 8.
The cash forecast needs to reflect the payment date.
| Event | Timing | Cash impact |
|---|---|---|
| AI workload usage | November | $0 at consumption, assuming postpaid billing |
| Vendor invoice | Early December | $0 when issued, assuming no immediate payment |
| Vendor payment | December 8 | −$3,000 |
This is a hypothetical postpaid example. Some providers charge cards more frequently, draw from prepaid balances, or enforce other billing arrangements.
Why weekly forecasting matters
A monthly forecast may show that a startup has enough money to cover its expenses.
But weekly cash movements tell a more precise story.
Imagine a company begins a particular week with $40,000 in its bank account.
During the week, it expects:
- $5,000 in customer collections
- $18,000 in payroll
- $3,000 in AI provider payments
- $6,000 in other operating payments
Projected ending cash:
$40,000 + $5,000 − $18,000 − $3,000 − $6,000 = $18,000
The forecast tells the founder more than the monthly AI bill.
It shows how infrastructure payments interact with payroll and other obligations.
Move the $3,000 AI payment into a different week, and the company's weekly minimum cash balance may change.
If a customer collection is delayed, that week's cash balance changes again.
Track AI credits separately
Suppose you have $10,000 in remaining API credits and expect $4,000 of eligible monthly usage.
Your economic model should still track the consumed services.
But the cash forecast should account for the applicable credits and their depletion schedule.
If credits are consumed at the forecast rate, your future cash payments could rise sharply once the balance is exhausted.
Do not record credit usage as customer revenue or subtract a cash payment that has already been covered by credits.
Connect AI spending to the zero-cash date
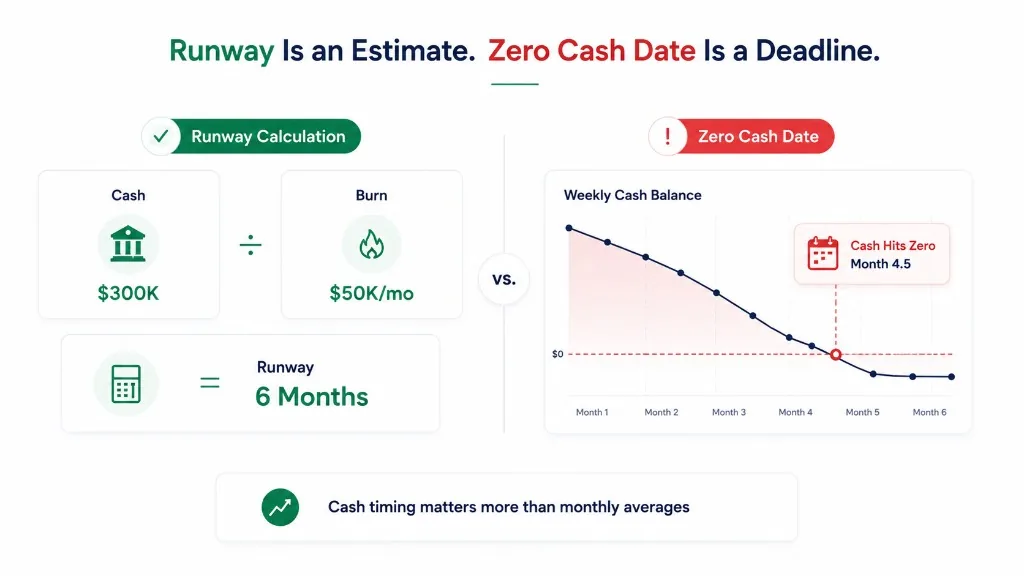
A zero-cash date is the projected date when available cash reaches zero under a given forecast.
A more conservative operating model can also track when cash crosses a minimum required balance, or cash floor.
To calculate it, build a time-based forecast:
Ending cash = opening cash + dated cash inflows − dated cash outflows
Apply that formula across each forecast period.
AI provider payments should be entered based on their expected settlement dates, not simply spread evenly through the month.
For founders trying to manage infrastructure spending alongside payroll, this matters enormously.
Learn more about what a 13-week cash flow forecast is, or use the free 13-week cash flow template to organize upcoming receipts and payments.
AI Compute Cost Forecast Worksheet: What to Track
You do not need an elaborate finance platform to begin forecasting AI expenses.
Start with a spreadsheet containing one row per workload, model, and reporting period.
The following fields provide a practical starting point.
| Input | Example |
|---|---|
| Reporting period | November 2026 |
| Workload | Financial analysis |
| Active users | 200 |
| Tasks per active user | 50 |
| Model calls per task | 3 |
| Retry/failure adjustment | Measured from production |
| Uncached input tokens per call | 4,000 |
| Cached input tokens per call | 0 |
| Output tokens per call | 1,000 |
| Model identifier | Current versioned model |
| Input price | USD per million tokens |
| Cached input price | USD per million tokens |
| Output price | USD per million tokens |
| Tool and infrastructure charges | USD |
| Available provider credits | USD |
| Expected billing date | Provider-specific |
| Expected payment date | Provider-specific |
Calculate each workload's expected model consumption.
Add supporting costs.
Group results by feature, customer segment, and month.
Then create a separate cash-payment schedule that reflects vendor billing arrangements.
The spreadsheet should distinguish forecasts from actual provider consumption. As production data becomes available, replace assumptions with measured token counts, cache rates, and agent traces.
For a general cash planning starting point, the Zensus 13-week cash flow template can help organize the resulting vendor payments. It is not a dedicated AI token-cost calculator.
How to Reduce AI Costs Without Sacrificing Product Quality
The best optimization is not necessarily choosing the cheapest model.
It is reducing unnecessary spend while preserving the experience customers pay for.
Route tasks to appropriately sized models
Use simpler or less expensive models for straightforward classification, extraction, or routing where testing confirms acceptable accuracy.
Reserve more expensive models for tasks that genuinely require them.
Measure the resulting changes in cost, quality, and latency.
Use prompt caching where appropriate
Repeated context can be expensive.
Some providers offer lower prices when eligible input tokens are served through caching.
But savings depend on cache eligibility, cache-write costs, hit rates, and provider rules.
Calculate the actual difference rather than assuming a fixed percentage reduction.
Reduce unnecessary agent loops
Place limits on retries, repeated tool calls, and workflow depth.
Track incomplete tasks and expensive outliers.
Sometimes the largest cost improvement comes from fixing an unreliable workflow rather than changing models.
Consider batch processing
Not every request needs an immediate response.
Offline reporting, document processing, or background analysis may qualify for lower-cost processing modes.
For example, OpenAI documents a 50% Batch API discount for supported workloads. Eligibility, processing time, and applicable rates must be checked against current documentation.
See the OpenAI Batch API guide.
Improve workload attribution
Track the cost of serving each meaningful customer action.
If one feature consumes disproportionate resources, consider pricing limits, quotas, model-routing changes, or separate paid tiers.
The objective is to build better unit economics without degrading the core product.
Next Step: Forecast the Runway Impact of AI Spending
Understanding your AI compute costs is an important first step.
But founders also need to understand what happens after those costs appear in the operating budget.
Suppose you're considering a new AI feature that will add $5,000 in monthly infrastructure spending.
Can you afford it?
What happens if customer adoption is slower than expected?
What if your usage doubles before revenue catches up?
And how will those expenses interact with payroll, customer payments, and your remaining cash?
These are cash flow forecasting questions as much as engineering questions.
Zensus helps founders model financial scenarios and understand how changing operating expenses affect their cash flow and runway.
You can incorporate projected AI infrastructure payments into your financial assumptions, compare a scenario against your baseline, and evaluate its impact alongside other operating obligations.
Zensus is not a dedicated AI token-metering or compute-pricing platform. Your workload estimates still need to come from your AI providers and engineering telemetry.
But once you understand your expected compute spending, the next question becomes much more important:
How much runway does that spending leave your business?
Explore Zensus and calculate your runway.
Editorial note: All worked dollar examples in this guide are hypothetical unless linked to a provider's documentation. AI pricing changes frequently. Verify current model prices, billing terms, and account-specific commitments before making financial decisions.
Technical and financial references: OpenAI API pricing, Anthropic Claude pricing, Google Cloud generative AI pricing, AWS EC2 pricing, FinOps Foundation's FinOps for AI guidance, and Langfuse's LLM cost-management documentation. Pricing references checked October 29, 2026.