Your bank balance tells you how much cash you have today. A cash flow early warning system tells you whether you'll have enough when it really matters, early enough to do something about it.
The Money Was Coming. The Bills Arrived First.
I was reviewing the books on Monday, November 2, 2026, and everything looked fine. We had $60,000 in the bank.
Payroll of $35,000? Set for Wednesday. A $50,000 customer payment? Due Thursday. Vendor invoices of $30,000? Friday.
"We're good," my team said. "We'll end the week with $45,000. No worry needed."
Then, on Wednesday, the customer called. Something came up. "We can pay next Monday."
By Friday afternoon, we had a $5,000 shortfall. We couldn't pay everyone on time.
This is a simplified scenario to illustrate the concept.
Here's what hurt: the revenue hadn't disappeared. The contract was still valid. On paper, we were still profitable.
But we didn't have the cash to meet our obligations on time.
That's the kind of moment that keeps finance people up at night. Not a missing customer or an empty bank account, but the gap between where you expect to be and where your cash actually is. The guide to knowing whether you will make payroll covers the same problem from the payroll side.
A cash flow early warning system exists to make that risk visible while there's still time to act.
What Is a Cash Flow Early Warning System?
Put simply, it's a way of checking your financial pulse, not just your temperature.
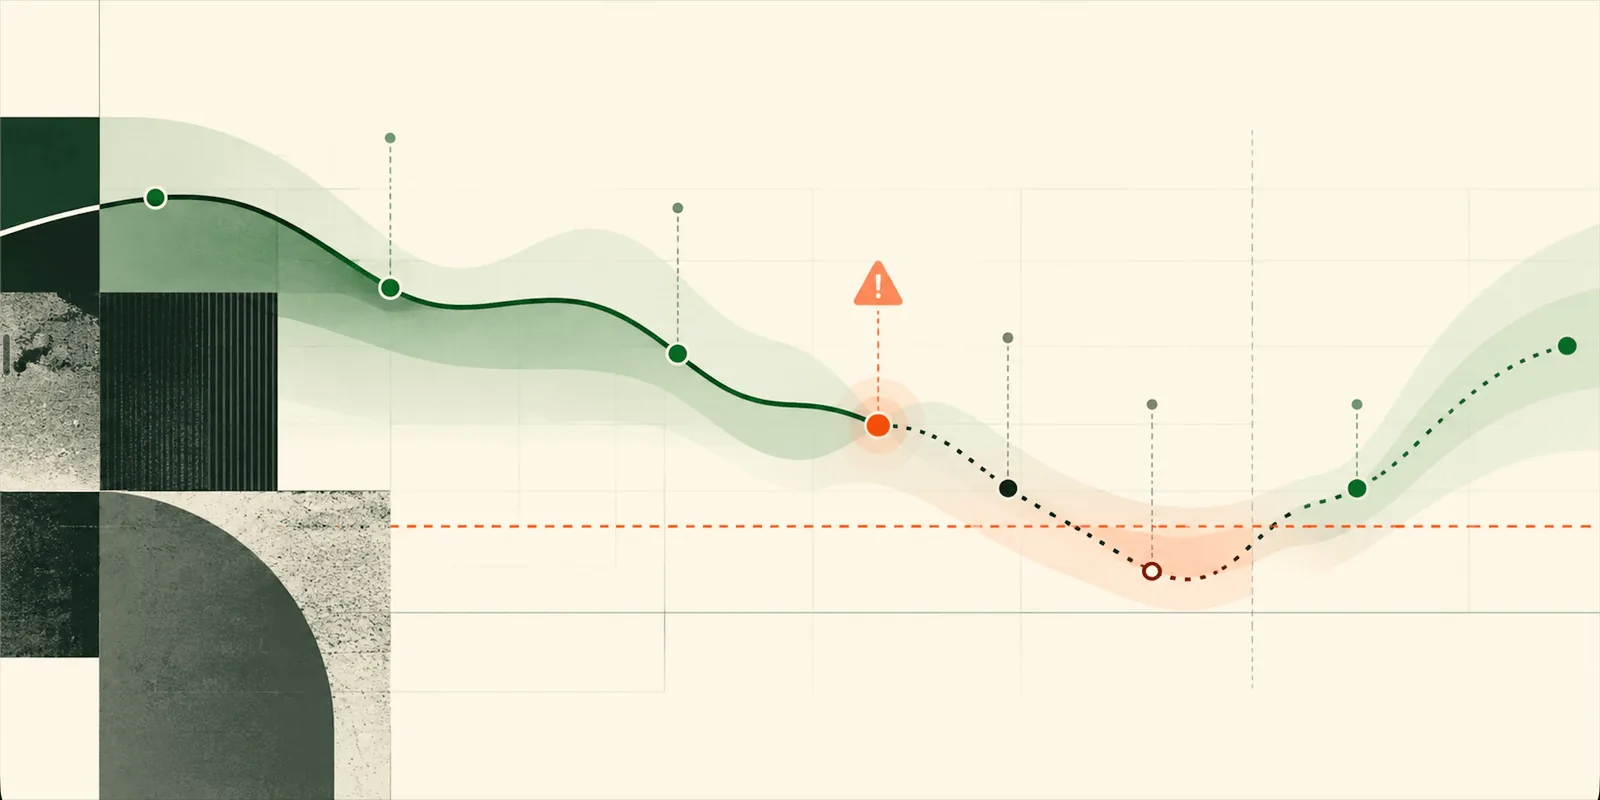
A cash flow early warning system monitors financial indicators, projects future cash balances, and flags potential liquidity problems before they become crises.
It combines four pieces: reliable financial data, forward-looking cash forecasts, warning thresholds, and a process for taking action when those thresholds are crossed.
Traditional financial reports tell you how you did last month. An early warning system asks what will happen next week, next month, and over the coming quarter.
It should answer four questions:
- How much usable cash do we have right now?
- When will our cash balance hit its lowest point?
- How much of that low point depends on uncertain customer payments?
- How much time do we have to respond before it becomes an emergency?
The difference matters. A business can have growing revenue, profitable contracts, and substantial outstanding invoices while still not being able to pay its staff or suppliers on time.
The purpose isn't to predict every financial problem. It's to spot the problems that are becoming likely before they become unavoidable.
What Are the Early Warning Signs of a Cash Flow Crisis?
Cash flow problems rarely announce themselves with a dramatic bank balance alert.
They often creep up through small changes: customers paying a day late, operating costs rising slightly, or the assumptions behind your forecast turning out to be optimistic.
Here are six indicators worth watching.
1. Your Lowest Projected Cash Balance Keeps Falling
Today's bank balance can fool you.
Suppose your company has $150,000 in cash. Your latest 13-week cash flow forecast shows the balance will dip to $18,000 in week eight before recovering.
If your business needs a minimum reserve of $40,000 to cover unexpected expenses, that projected low point is already a problem.
What matters is the gap between your lowest projected cash balance and the minimum amount you actually need to keep the lights on.
Cash headroom = Lowest projected cash balance − Minimum cash threshold
In this example: $18,000 − $40,000 = −$22,000.
That's a $22,000 reserve shortfall.
You might not run out of money entirely, but your cash balance dips below the safety net your team established. That's a warning worth investigating today.
2. Customers Are Taking Longer to Pay
Days sales outstanding (DSO) measures the average time between when you sell something and when you collect payment.
A common calculation is:
DSO = (Average accounts receivable ÷ Net credit sales) × Number of days
Suppose a business has $180,000 in average accounts receivable and $360,000 in net credit sales over 90 days.
DSO = ($180,000 ÷ $360,000) × 90 = 45 days.
Now imagine its DSO rises from 45 to 58 days. The business is taking about 13 extra days to collect payments.
That doesn't mean the company is in trouble. But if payroll, rent, and vendor payments stay the same, those extra 13 days mean less cash in hand today. The cash conversion cycle guide shows how DSO ties up cash alongside inventory and payables.
I'd pay particular attention to whether this is a one-time occurrence or a pattern.
A single late payment happens. A sustained deterioration in customer payment behavior is worth investigating.
3. Your Overdue Receivables Are Aging Faster
The total accounts receivable balance can look healthy even when collections are deteriorating.
Consider a business with $200,000 in outstanding invoices:
| Receivables aging | Previous month | Current month |
|---|---|---|
| Current | $140,000 | $100,000 |
| 1 to 30 days overdue | $40,000 | $50,000 |
| 31 to 60 days overdue | $15,000 | $30,000 |
| Over 60 days overdue | $5,000 | $20,000 |
| Total receivables | $200,000 | $200,000 |
The total balance is unchanged. But the amount more than 30 days overdue has more than doubled, from $20,000 to $50,000.
That's meaningful deterioration.
An early warning system should monitor not just the value of outstanding invoices but also how quickly they're aging.
One useful metric is:
Overdue concentration = Receivables more than 30 days overdue ÷ Total receivables
In this example, overdue concentration increases from 10% to 25%.
That tells management something the headline receivables balance doesn't: money expected to arrive is becoming less predictable.
4. Your Business Depends Too Heavily on One Customer
Customer concentration isn't just a revenue risk. It's also a liquidity risk.
Suppose a business expects $150,000 in customer payments over the next four weeks. Of that amount, $90,000 is from one customer.
Receivables concentration = Largest expected customer payment ÷ Total expected collections
$90,000 ÷ $150,000 = 60%.
One customer represents 60% of expected collections. If that payment arrives two weeks late, it could mean missed payroll or unpaid vendors.
The relevant question isn't just whether the customer is financially healthy. It's this: if that customer paid two weeks later than expected, could we meet our obligations?
An early warning system should identify which major customer payments are holding up your cash balance. Service businesses with a few large clients feel this most; see cash flow forecasting for agencies.
5. Your Cash Burn Is Increasing
Cash burn describes the rate at which you consume available cash.
For a business spending more than it receives:
Net cash burn = Cash outflows − Cash inflows
Suppose monthly cash outflows total $90,000 and inflows total $65,000. Net cash burn is $25,000.
If monthly spending increases to $105,000 while collections remain unchanged, net burn rises to $40,000.
For a company with $200,000 in cash, that takes simplified runway from eight months down to five.
That calculation assumes cash moves smoothly on a monthly basis. Real businesses rarely operate that evenly. A runway number is a useful starting point, but it can't identify a shortfall caused by payroll falling three days before a major customer payment. Runway vs burn rate explains both numbers in more detail.
For that, you need a dated cash flow forecast.
6. Your Forecast Keeps Getting Customer Payments Wrong
A forecast should be measured against reality.
Suppose you expected to collect $75,000 during a week but received $55,000. That's a $20,000 unfavorable variance.
That difference can mean two very different problems:
- If the remaining $20,000 arrives the following week, your forecast had a timing error.
- If a customer disputes the invoice and the expected amount falls permanently, your forecast had an amount error.
Both matter, but they require different responses.
Repeated unfavorable timing differences may be an early sign that the business is relying on unrealistic collection dates.
This is why comparing forecasts with actual cash movements should be part of your weekly management process. Predictive cash flow forecasting walks through how to measure that variance.
How Do You Calculate Your Zero-Cash Date Accurately?
Your zero-cash date is the first projected date on which usable cash reaches zero or becomes negative, based on your forecast assumptions.
It's a more precise measure than estimating runway from average monthly burn.
The basic runway calculation is:
Cash runway = Available cash ÷ Monthly net cash burn
But that calculation assumes cash is consumed relatively evenly. It doesn't account for large customer receipts, payroll dates, taxes, or one-time payments.
To identify a potential zero-cash date, project receipts and payments on the dates you expect them to settle.
For each date:
Closing cash = Opening cash + Cash received − Cash paid
Then carry the closing balance forward.
Here is the scenario from the beginning of this article:
| Date | Cash movement | Amount | Closing cash |
|---|---|---|---|
| Mon, Nov 2 | Opening balance | $60,000 | |
| Wed, Nov 4 | Payroll | −$35,000 | $25,000 |
| Thu, Nov 5 | Customer payment | +$50,000 | $75,000 |
| Fri, Nov 6 | Vendor payment | −$30,000 | $45,000 |
Under the original assumptions, the business remains cash-positive.
Now move the customer payment to Monday, November 9:
| Date | Cash movement | Amount | Closing cash |
|---|---|---|---|
| Mon, Nov 2 | Opening balance | $60,000 | |
| Wed, Nov 4 | Payroll | −$35,000 | $25,000 |
| Fri, Nov 6 | Vendor payment | −$30,000 | −$5,000 |
| Mon, Nov 9 | Customer payment | +$50,000 | $45,000 |
The first projected negative cash balance occurs on November 6.
The bank may not actually allow that negative balance. It represents an unfunded obligation unless the business arranges additional liquidity or changes a payment date.
For cash management purposes, that distinction is essential.
A good early warning system also calculates the first date the business falls below its minimum operating cash threshold. That date may arrive well before the zero-cash date.
And if the business never reaches zero within the forecast period, the system should say so. A forecast shouldn't invent certainty beyond the period it can reasonably model. The zero cash date guide works through a longer example, and the free runway calculator gives a first estimate in a minute.
How Much Cash Should Your Business Keep in Reserve?
There is no single minimum cash balance that suits every business.
A company with predictable subscription revenue and flexible expenses faces different risks from one that depends on a few large customers and fixed payroll.
A practical approach is to write a minimum cash policy around the expenses the business must cover during a reasonable response window.
The response window is the time management expects it would need to arrange funding, improve collections, cut discretionary spending, or otherwise address a liquidity problem.
Start by listing unavoidable cash obligations over that period. Suppose a business decides it needs a four-week response window:
| Essential outflow over four weeks | Amount |
|---|---|
| Payroll and employer taxes | $35,000 |
| Rent | $8,000 |
| Debt payments | $5,000 |
| Essential suppliers | $12,000 |
| Total unavoidable outflows | $60,000 |
Next, account for forecasting uncertainty.
How Do You Calculate a Forecast Error Margin?
Instead of choosing an arbitrary percentage, review past differences between forecast and actual cash requirements.
Suppose the unfavorable errors in total four-week net cash requirements over the last six comparable periods were $4,000, $7,000, $3,000, $9,000, $5,000, and $8,000.
The largest observed unfavorable difference was $9,000. Management could use that figure as a preliminary reserve margin.
Minimum cash threshold = Essential outflows during response window + Forecast error margin
$60,000 + $9,000 = $69,000.
Under this illustrative policy, the business would aim to keep at least $69,000 in accessible cash.
This method is deliberately conservative about incoming receipts. It assumes the business may need to cover its essential expenses during a period when collections are disrupted.
Six observations provide only a rough starting estimate, not a statistically reliable worst case. The business should also consider risks absent from its history, and review the margin as it accumulates more forecasting data.
What Are Cash Buffer Days?
Another useful measure is the number of days a business could cover its usual cash outflows without receiving new cash.
Cash buffer days = Available cash ÷ Average daily cash outflows
Suppose a business has $90,000 in usable cash and spends an average of $3,000 per day. It has about 30 cash buffer days.
In a September 2016 report analyzing roughly 597,000 small businesses, the JPMorgan Chase Institute found a median cash buffer of 27 days.
That benchmark provides context, but it isn't a recommended minimum for every business. Your minimum cash policy should reflect your own payment obligations, collection uncertainty, and ability to respond when conditions change.
How Do You Create Cash Flow Alerts That Lead to Action?
A warning threshold is useful only when it leads to a decision.
Rather than using arbitrary percentages, set alerts around your company's minimum cash policy. Suppose the minimum cash threshold is $69,000:
| Status | Example trigger | Response |
|---|---|---|
| Normal | Forecast stays above $80,000 | Continue routine monitoring |
| Warning | Forecast falls below $80,000 | Investigate upcoming payments and review options |
| Critical | Forecast falls below $69,000 | Escalate to the responsible finance decision-maker |
| Cash shortfall | Forecast reaches zero or less | Close the immediate funding or payment gap |
The $80,000 warning level provides an extra $11,000 cushion above the minimum reserve.
The specific threshold should reflect how quickly the business can act. A company that needs six weeks to arrange financing may need an earlier warning than one with reliable, immediately accessible liquidity.
Alerts should also account for timing. A forecast showing a critical balance tomorrow deserves more urgent attention than the same projected balance ten weeks away.
A useful warning therefore says three things:
- how much cash is at risk
- when the problem may occur
- how much time remains to respond
Why Is a 13-Week Rolling Cash Flow Forecast Better Than a Monthly P&L?
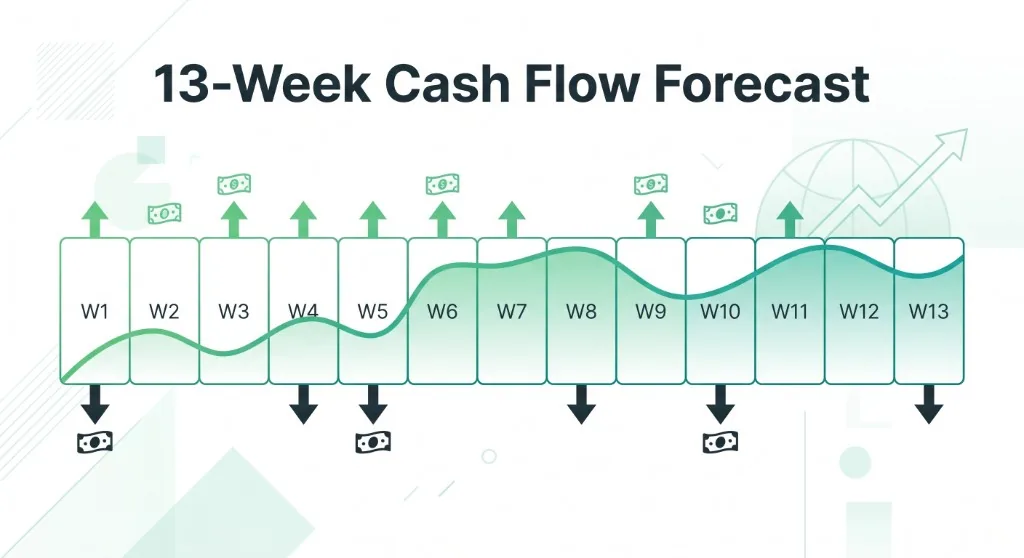
A monthly profit and loss statement measures business performance over an accounting period. A 13-week cash flow forecast estimates when money will enter and leave the business over about one quarter.
These are different questions.
A business could record $120,000 in revenue and $95,000 in expenses, generating $25,000 in accounting profit. But if customers haven't paid their invoices, the business may still struggle to meet payroll.
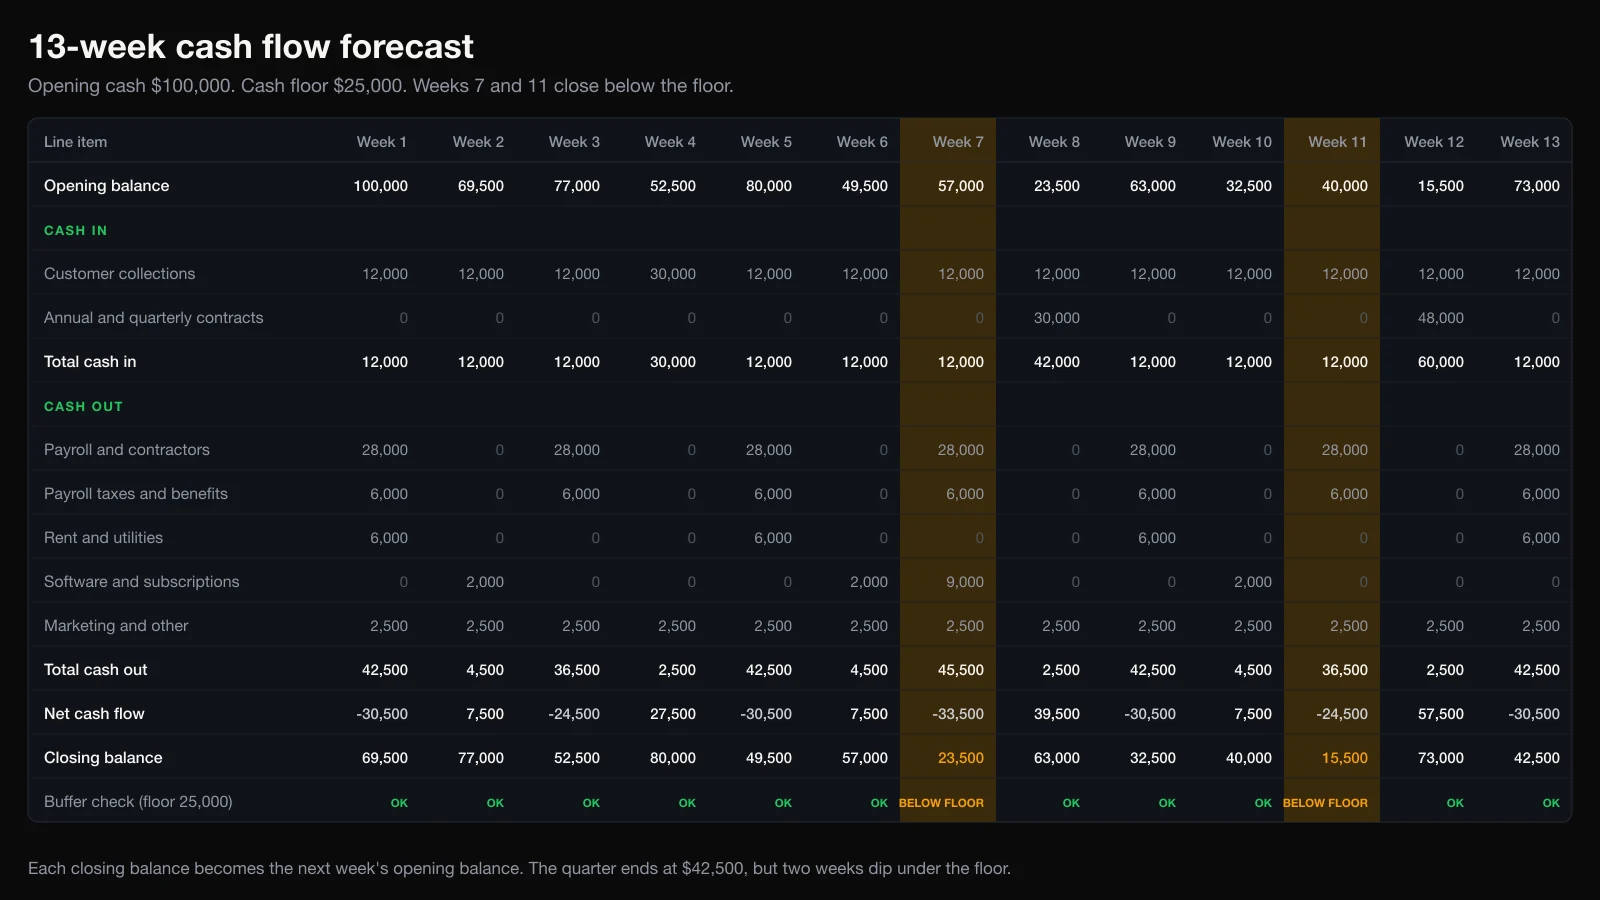
A 13-week forecast works directly with expected cash receipts and payments. Each week begins with the previous week's closing cash balance. Expected customer payments increase the balance. Payroll, suppliers, taxes, debt payments, and other disbursements reduce it. The result is a forward-looking view of cash availability.
Thirteen weeks is a useful planning horizon because it captures several payroll cycles, recurring expenses, and expected customer payments while staying close enough for near-term assumptions to be reviewed often.
But it isn't sufficient in every situation. If a company operates with a narrow cash cushion, it may need daily forecasting for the next two weeks. A weekly closing balance can hide a shortage that occurs on Thursday and disappears after a customer pays on Friday.
The monthly P&L still matters because it explains profitability and expense performance. The 13-week forecast complements it by revealing liquidity and payment-timing risk. For the basics of both, see what is cash flow forecasting?
What Data Do You Need to Build a Cash Flow Early Warning System?
You don't need perfect financial data to begin. But you do need to identify the information that can materially change your forecast.
1. Available Cash
Begin with reconciled bank balances across the accounts included in your forecast. Exclude restricted or unavailable funds, and don't treat transfers between your own accounts as new cash inflows.
2. Accounts Receivable
Collect outstanding invoices, customer names, amounts, contractual due dates, and realistic expected payment dates. Include past collection behavior where you have it, and keep invoices already issued separate from anticipated future sales.
3. Accounts Payable and Committed Expenses
Record vendor invoices, contractual payment dates, payroll, taxes, rent, debt obligations, and significant one-time expenses. Note which payments are legally or contractually fixed and which are discretionary.
4. Revenue and Operating Assumptions
Document the assumptions that affect future receipts and expenses, such as customer renewals, planned hiring, expected revenue growth, and changes in supplier costs.
5. Historical Forecasts and Actuals
Keep prior forecast versions alongside actual receipts and payments. You need them to understand forecast accuracy and improve your assumptions.
A useful data structure is simple:
| Input | Minimum information |
|---|---|
| Cash accounts | Available balance, balance date |
| Receivables | Customer, invoice amount, expected receipt date |
| Payables | Vendor, amount, expected payment date |
| Payroll | Amount, scheduled payment date |
| Recurring expenses | Amount, frequency, next payment date |
| Forecast assumptions | Description, value, effective date |
| Historical actuals | Transaction date, amount, category |
As the process matures, a business can introduce automated imports, reconciliation, and monitoring. But automation doesn't make unreliable assumptions correct. The quality of the warning still depends on the quality of the inputs.
How Do You Tell a Delayed Payment From a Real Cash Shortfall?
This is one of the most important parts of maintaining an early warning system.
At the end of each week, compare the original forecast with actual receipts and payments. Then separate timing differences from amount differences.
Suppose the company expected to collect $80,000 but received $60,000. The difference is $20,000. Now investigate the cause.
Timing Variance
A customer still owes the full $20,000, but the payment is now expected next week.
The money hasn't necessarily been lost; its expected arrival date has changed. The forecast should move the receipt to the revised date and recalculate future cash balances. If that change creates a temporary shortage, management still needs to respond.
Amount Variance
A customer disputes $8,000 of the invoice and is only expected to pay $12,000.
In this case, the expected amount has changed. The model needs to reflect both the revised payment value and any remaining uncertain balance.
The distinction matters because a late receipt might create a temporary liquidity gap, while a permanent reduction in collections can create a more persistent funding problem.
When Should a Variance Trigger an Alert?
Suppose a business tracks the following collection results:
| Week | Forecast receipts | Actual receipts | Difference |
|---|---|---|---|
| 1 | $45,000 | $38,000 | −$7,000 |
| 2 | $50,000 | $41,000 | −$9,000 |
| 3 | $55,000 | $43,000 | −$12,000 |
Receipts are falling short of expectations in three consecutive weeks. That pattern deserves investigation. The cash may eventually arrive, but repeated delays suggest the collection assumptions need to change.
A business could set a policy that triggers an extra review after three consecutive unfavorable weekly collection variances. Three weeks is an illustrative rule, not a universal standard: a single missed $100,000 payment may be more urgent than several smaller errors. The system should consider both the size of the variance and its effect on future cash balances.
How Do You Improve Forecast Accuracy?
Review forecasting errors using four questions:
- Accuracy: how large are the differences between forecast and actual cash movements?
- Bias: does the business consistently overestimate collections or underestimate payments?
- Volatility: how much do the errors change from one period to the next?
- Persistence: do the same errors continue even after the forecast is updated?
According to the 2026 AFP FP&A Benchmarking Survey, only 14% of finance teams formally track forecast accuracy. That suggests a significant opportunity to make forecasting more measurable.
But measurement alone isn't the goal. A useful variance review should change the assumptions in the next forecast. If a customer consistently pays 12 days later than expected, future projections should reflect that. If cloud infrastructure expenses repeatedly exceed the forecast, the expense assumptions need revisiting.
Every forecast should teach you something about the next one.
How Do You Build Your First Cash Flow Early Warning System?
You can start with a spreadsheet:
- Record your current usable cash balance.
- List expected customer receipts and scheduled payments for the next 13 weeks.
- Calculate the opening and closing cash balance for each week.
- Find the lowest projected balance and check whether it falls below your minimum operating reserve.
- Test one realistic downside: move your largest expected customer payment two weeks later and recalculate. Does the low point change? Do you breach the reserve? Do you reach zero before the payment arrives?
- Review weekly: compare last week's forecast with actual cash movements, investigate important differences, and extend the forecast by another week.
- Assign an owner who keeps the data current, reviews the warning indicators, and decides when a projected shortfall needs action.
Without an owner and a review schedule, even a well-built forecast goes stale. The free 13-week cash flow template has the weekly layout ready, and how to build a 13-week cash flow forecast in Excel walks through the formulas.
Is Your Cash Flow Early Warning System Ready?
Before relying on your forecast for important decisions, check that your system has:
- reconciled and usable opening cash balances
- expected collection dates based on realistic customer payment behavior
- a schedule of committed and recurring cash obligations
- a rolling 13-week forecast
- a documented minimum cash policy
- calculated minimum-cash and zero-cash breach dates
- downside scenarios for concentrated or delayed receivables
- a weekly forecast-versus-actual review
- clear escalation rules and a responsible owner
These controls provide a practical starting point for a cash flow health check. The objective isn't to build the most sophisticated financial model. It's to build one that spots a meaningful problem early enough for management to act.
The Warning Should Arrive Before the Crisis
Most businesses can explain where their money went. Fewer can confidently explain where their cash balance might be six weeks from now.
That difference can decide whether a delayed payment becomes a minor inconvenience or a serious operational problem.
A useful cash flow early warning system doesn't need to predict every possible outcome. It needs to make the important assumptions visible, identify when cash becomes insufficient, and show how much time remains to respond.
At Zensus, we believe financial clarity should extend beyond the current bank balance. Business owners and finance teams should be able to see what changes when a customer pays late, an expense increases, or a major commitment comes due.
Because the most useful financial warning isn't the one that tells you cash has run out. It's the one that arrives while you can still do something about it.
If your business were going to run short of cash six weeks from now, would you know today?
Related guides:
- What is cash flow forecasting?: the methods, horizons and warning signs in one guide.
- Zero cash date: how to find the week cash runs out, not just the month.
- Will I make payroll?: project cash to each payroll date and check it against your buffer.
- What happens if you miss payroll?: the exposure, and what to do first.